Home & Global Resources
Blueprint Assess
Blueprint Migrate
Getting Started
The Blueprint User Interface
Change Your Password
Open a Project
Organize Artifacts and Assets
Close a Project
Status Indicators
Jobs
Exporting from Source RPA Tools
How to export a UiPath Automation Project from UiPath Orchestrator
How to export .bprelease files from Blue Prism
Blue Prism VBO Matching on Import
How to Export .zip files from Automation A360 Control Room
Importing
Exporting
RPA Export from Blueprint
Variable Prefixing
Why We Create Multiple Similar Subflows During Migration
Understanding Wrapper Subflows in Power Automate Desktop
Setting up defaultRunDotNetScriptReferences
AsEnumerable Support
XmlDocument Support
Bulk Reimport/Recalculate
Metabot Migration - Best Practices
Exporting Reusable Flows
DeconstructWorkQueueItem
Artifacts Management
Base Artifact Types
Creating and Managing Artifacts
Utility Panel
Using Descendants View
Global Actions
Rules
Rules Overview
Rule Pre-Requisites
Using Rules
Rules User Interfaces
Using the Rules Table
Using Rules CSV
Using the Rules Wizard
Custom Action Mapping
Reuse Mapping to Power Automate Desktop
Manual Reuse
TODO, Error, and Robin Mapping
Script Mapping
Variable Name Dependency Mapping
Variable Renaming and Initialization
DLL/Method Invocation Mapping
Unresolved References
Work Queues Mapping
Solutions & Best Practices
Working with Migration Output in Power Automate Desktop (PAD)
Blueprism to PAD Migration Output Details
UiPath to PAD Migration Output Details
A360 to PAD Migration Output Details
RPA Value-Mapping Assessments
Why Choose Blueprint Cloud vs. On Premise ?
Setting up SAP for RPA
UiPath Conversion of "Sharepoint Scope and Get File"
API & Developer Resources
REST API Request Header and Parameters
REST API Request Body and Parameters
REST API - Listing Artifacts in the Request Body
REST API - Defining an Artifact in the Request Body
REST API - Defining a Comment in the Request Body
REST API - Defining a Reply in the Request Body
REST API - Defining a Trace in the Request Body
REST API - Filter Parameter
REST API - Defining a User in the Request Body
REST API Requests
REST API - Add Attachment to Subartifact Request
REST API - Get Artifact Request
REST API - Add Traces Request
REST API - Get Project by Id Request
REST API - Update Custom Choice-Property Type Request
REST API - Publish Comments Request
REST API - Publish Artifact Request
REST API - Update Comment Request
REST API - Delete User Request
REST API - Add Comment Request
REST API - Close Review Request
REST API - Get Discussion Status Request
REST API - Update Reply Request
REST API - Get Attachment Request
REST API - Delete Comment Request
REST API - Create Project Request
REST API - Get Group Request
REST API - Rate Comment Request
REST API - Get Child Artifacts of Artifact Request
REST API - Discard Artifacts Request
REST API - List Artifacts Request
REST API - Rate Reply Request
REST API - Move Artifact Request
REST API - Delete Attachment Request
REST API - List Projects Request
REST API - Get Blueprint Product Version Request
REST API - Update Standard Choice Property Request
REST API - Get Review Request
REST API - Reply to Comment Request
REST API - Update User Request
REST API - Get Collection Request
REST API - Delete Artifact Request
REST API - List Collections Request
REST API - Authenticate Request
REST API - Get Artifact Type Request
REST API - List Artifact Types Request
REST API - Delete Reply Request
REST API - Get Root Artifacts of Project Request
REST API - Add Attachment Request
REST API - Create User Request
REST API - List Reviews Request
REST API - List Groups Request
REST API - Get User Request
REST API - Delete Traces Request
REST API - Add Artifact Request
REST API - List Users Request
REST API - Get Artifact Image Request
REST API - Update Artifacts Request
REST API - List Unpublished Artifacts Request
REST API HTTP Methods
REST API - HTTP HEAD Method
REST API - HTTP DELETE Method
REST API - HTTP GET Method
REST API - HTTP POST Method
REST API HTTP Status Codes
REST API - HTTP PATCH Method
Blueprint REST API
REST API Quick Start Example
REST API Requests and Responses
REST API Security and Authentication
REST API Known Issues & Constraints
REST API Requests
REST API Resources
REST API - Defining an ALM Job in the Request Body
Dashboards & Reports
Statistics Report Options
Using Scope and View
Statistics Dashboard
Statistics Reports
Applications Dashboard
Applications Report
Estimator Dashboard
Estimator Reports
How to Change the Main Process Label for Estimations
Bulk Reporting
Call Trees
Blueprint + PowerBI Dashboards
How to Create Microsoft Power Automate RPA Migration Estimates with Blueprint
Assessment Report
Licensing
Settings & Administration
Overview of Blueprint Settings
System Reports
System Reports
License and Activity Reporting
User List
Project Activity
User Roles
Artifact Map
Project Usage
User Activity Report
Audit Log
System Logs
User Management
Creating and Managing Users
Creating and Managing Groups
Creating and Managing Instance Administrator Roles
Creating and Managing Project Administrator Roles
RPA Management
Microsoft 365 Authentication Settings
Integration Reporting
Migrate - Import/Export
Migrate - Dashboards
Migrate
Analyze
Automation360 Authentication Settings
GenAI
Advanced Settings
Projects
Installation
Blueprint Installation Guide
System Requirements
Supported Third-Party Components
Azure App Registration (Power Automate Export)
Release Notes
Table of Contents
- All Categories
- Dashboards & Reports
- Blueprint + PowerBI Dashboards
Blueprint + PowerBI Dashboards
Blueprint's built-in dashboards can be augmented with additional, customizable dashboards powered by Microsoft PowerBI. These PowerBI Dashboards are displayed directly within Blueprint via iFrame. Pr…

Blueprint's built-in dashboards can be augmented with additional, customizable dashboards powered by Microsoft PowerBI. These PowerBI Dashboards are displayed directly within Blueprint via iFrame.
Pre-defined PowerBI Dashboards are provided out of the box. With PowerBI, these can be modified or entirely new dashboards can be created.
Pre-Defined PowerBI Dashboards
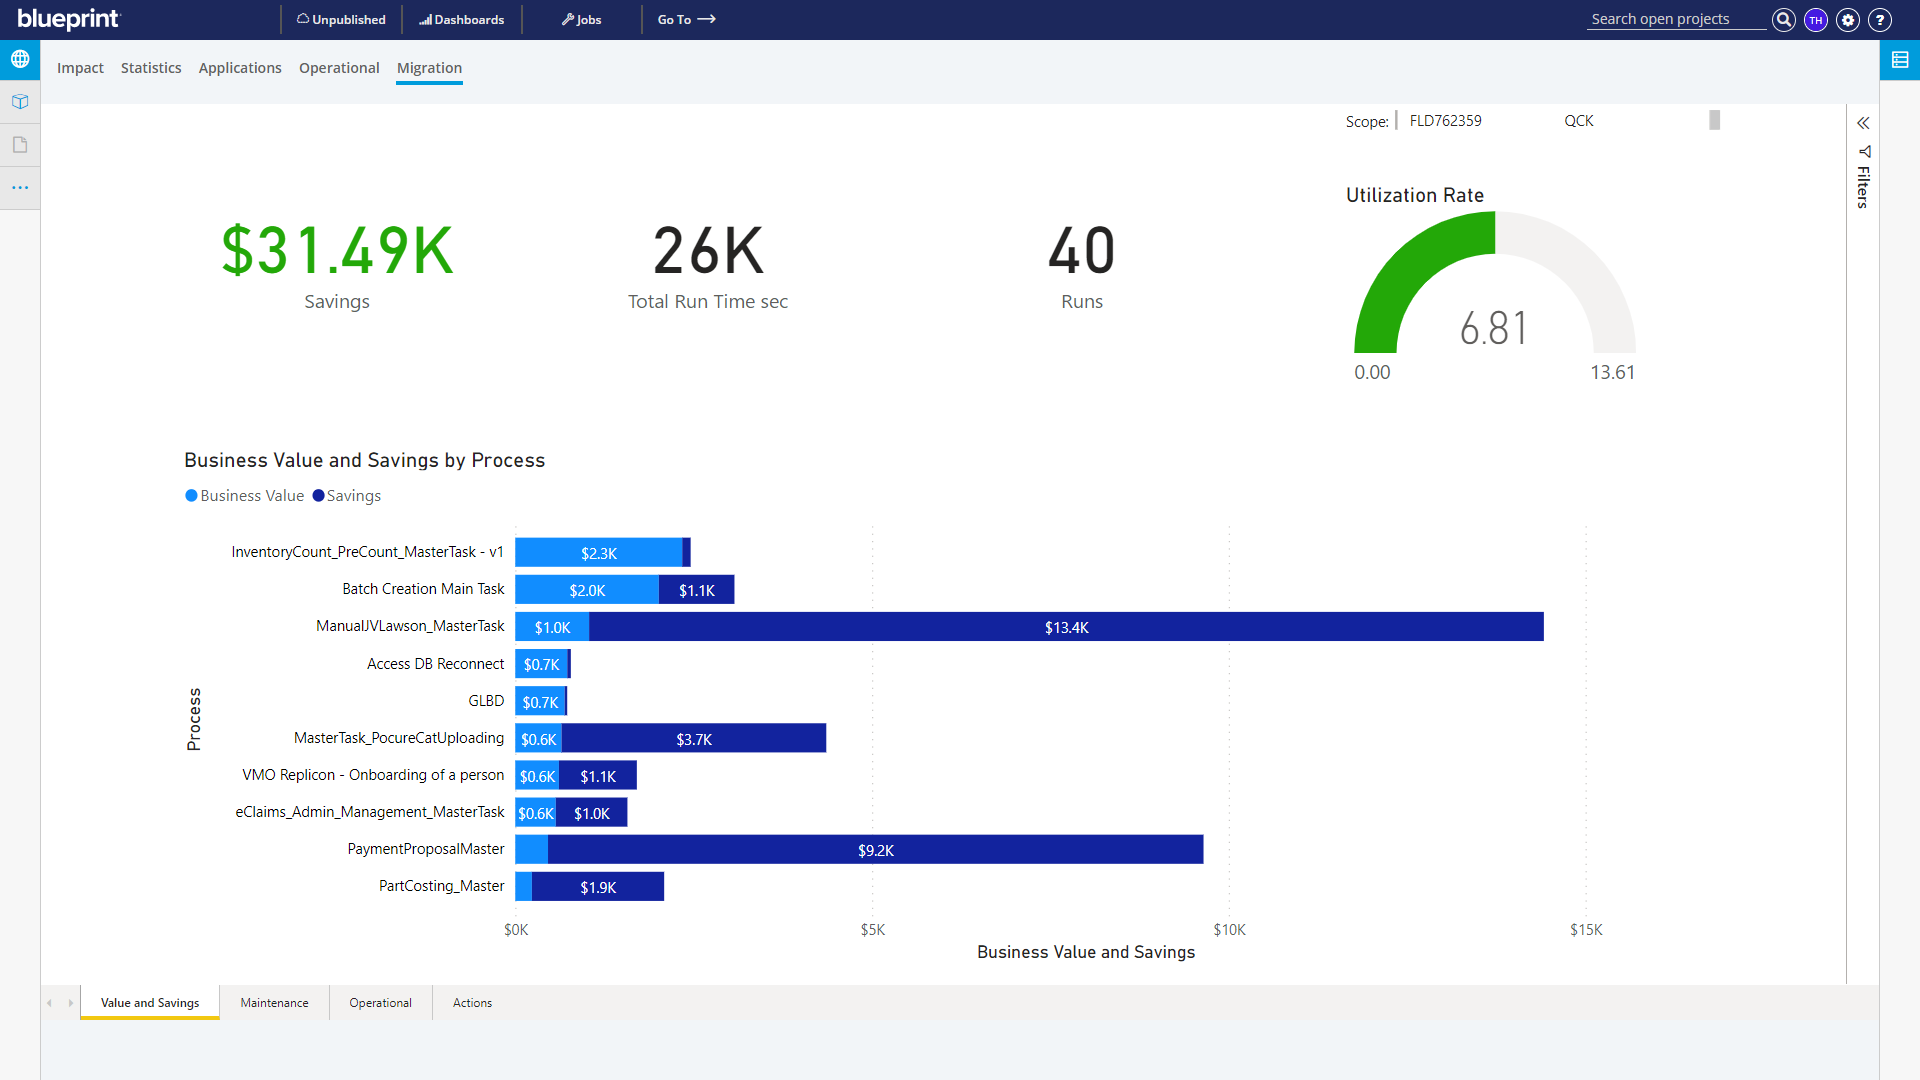
Value Analysis
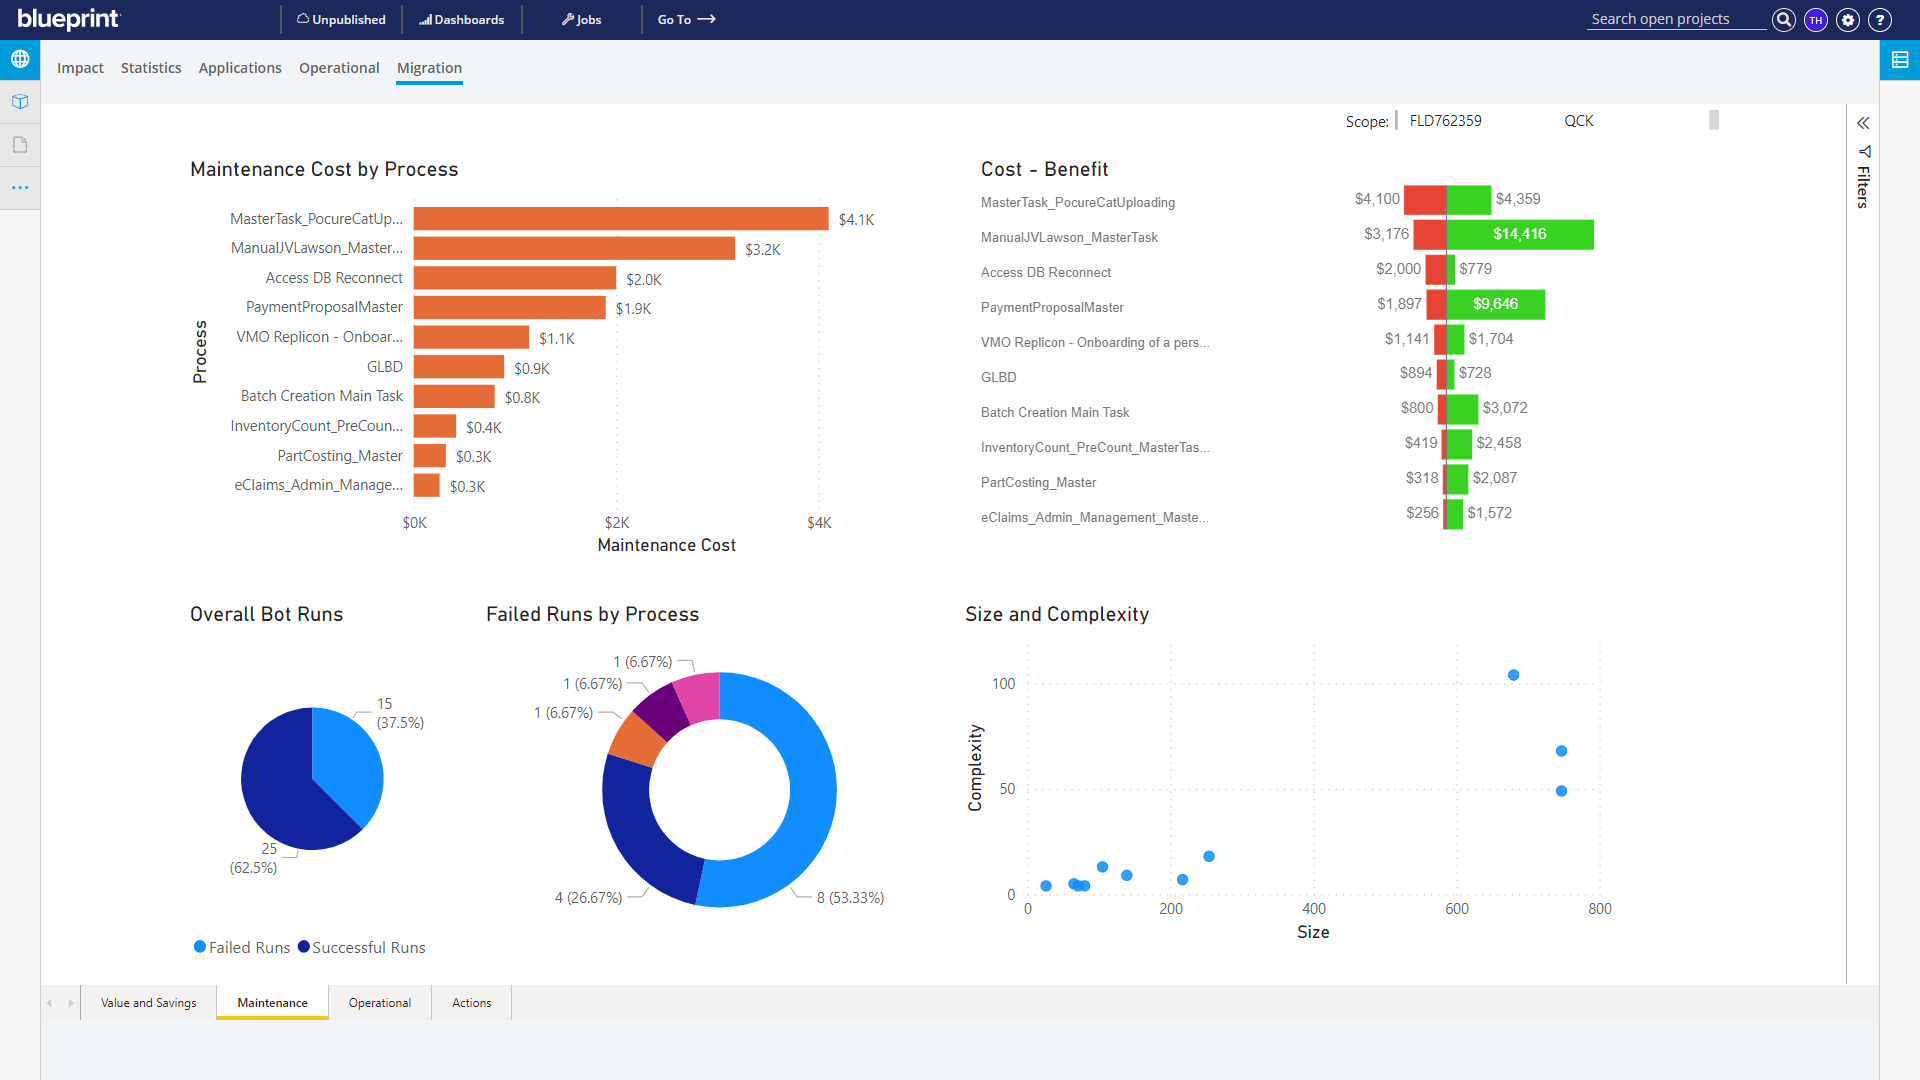
Maintenance Analysis
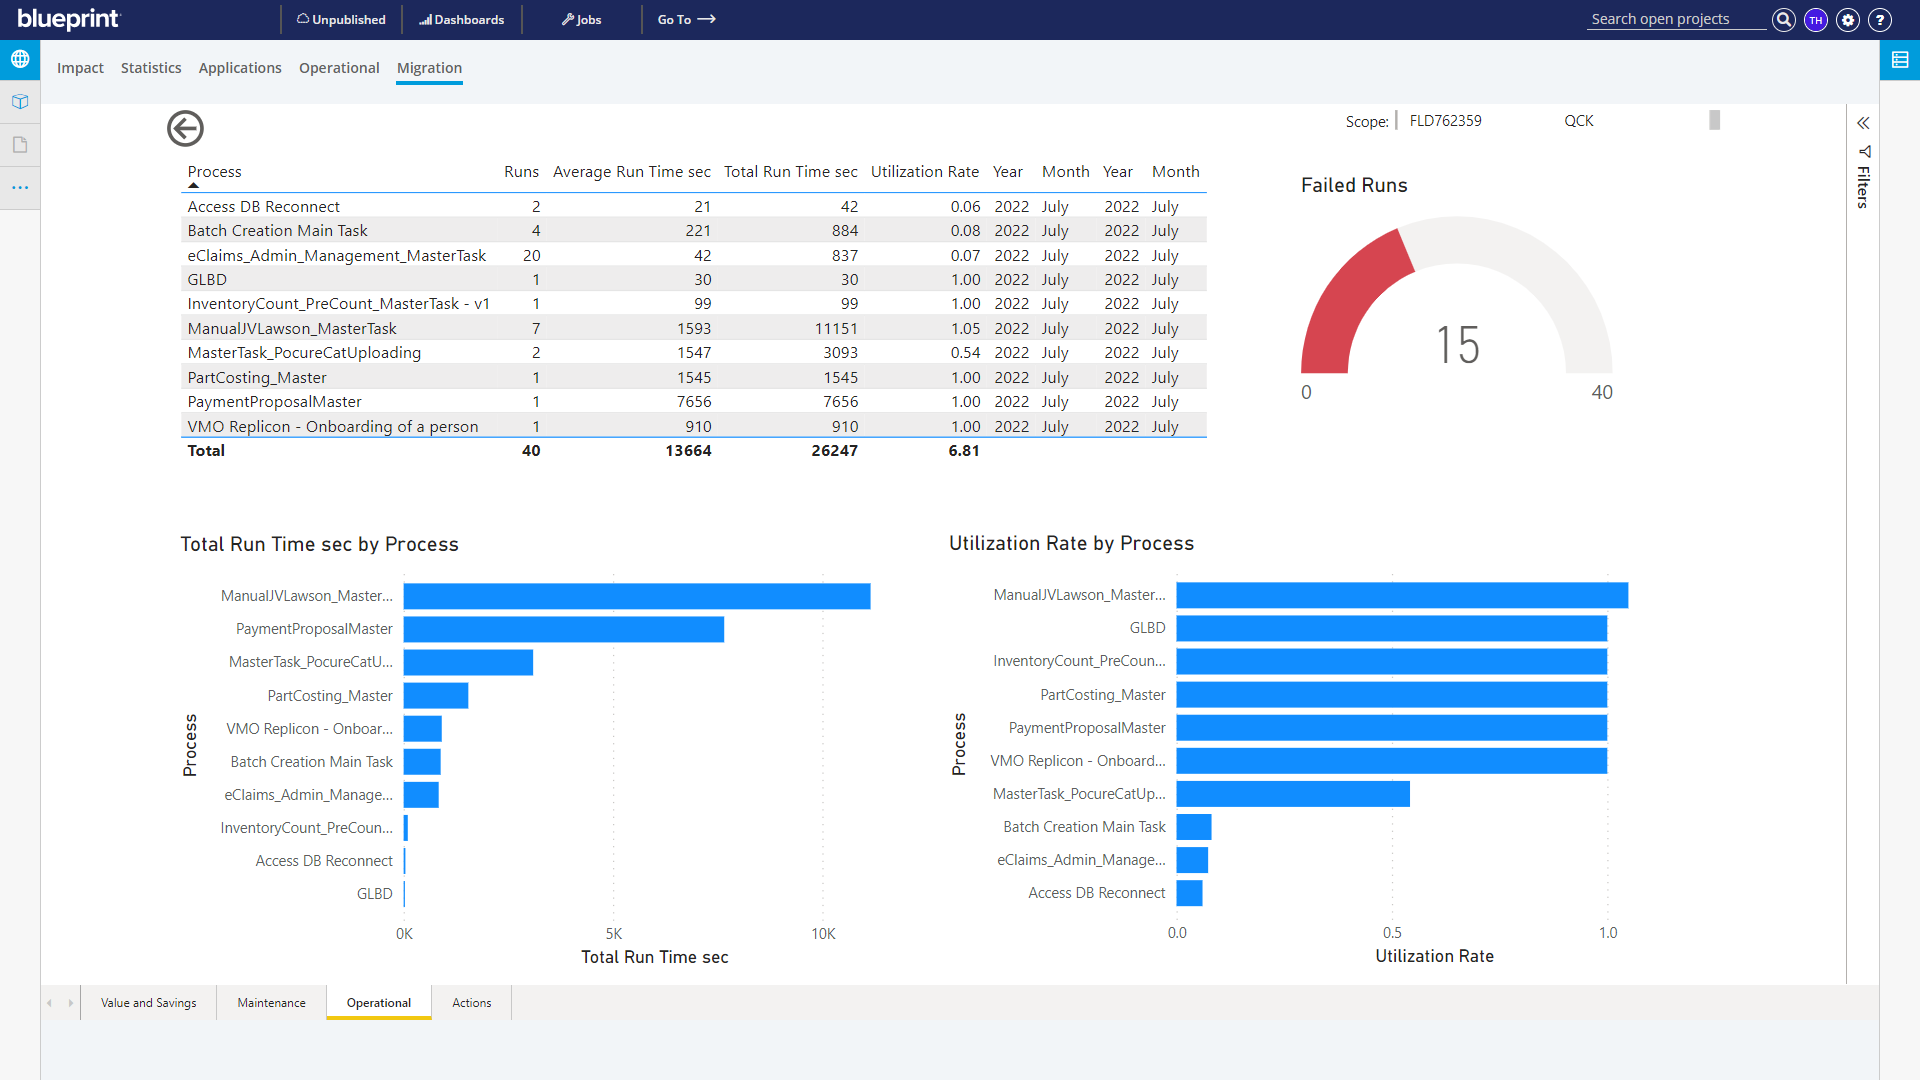
Operational Analysis
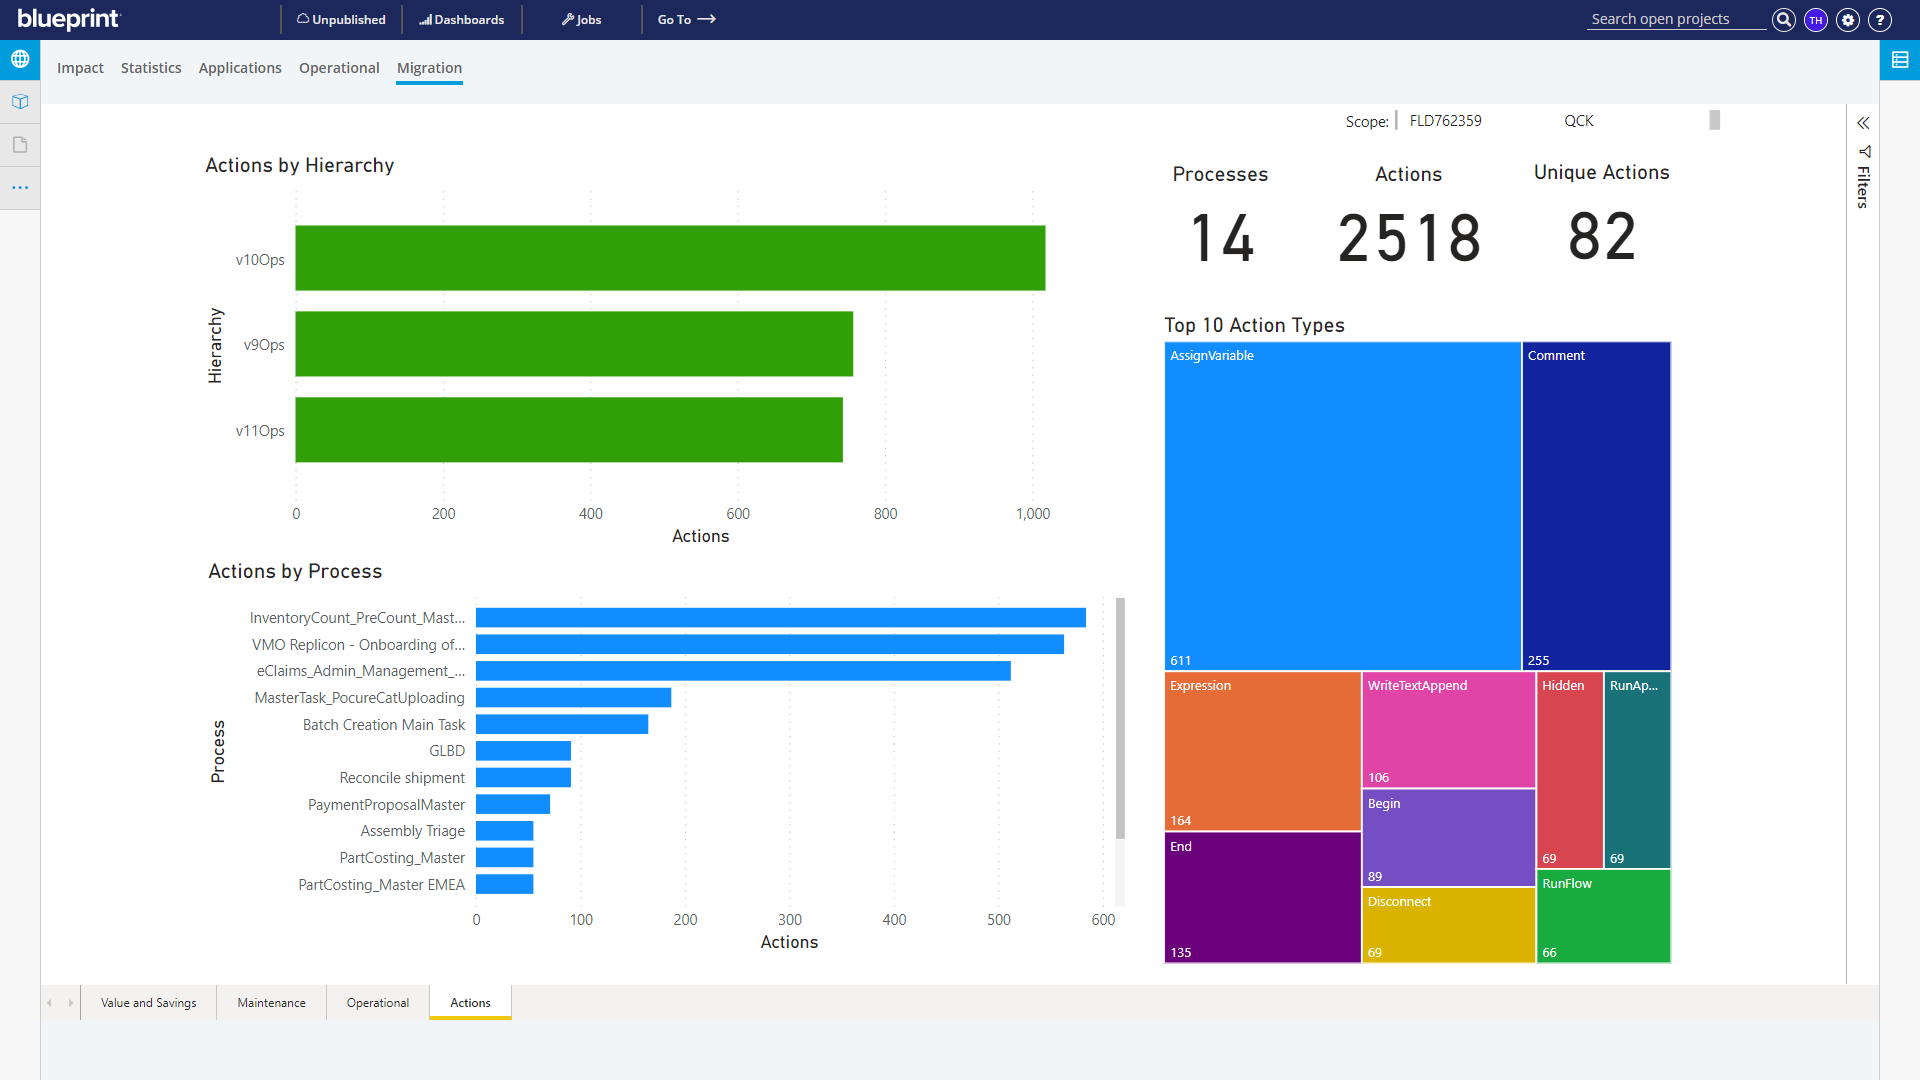
Commands Analysis
Creating PowerBI Dashboards
Step 1: A PowerBI Report containing dashboards must be created first before going further.
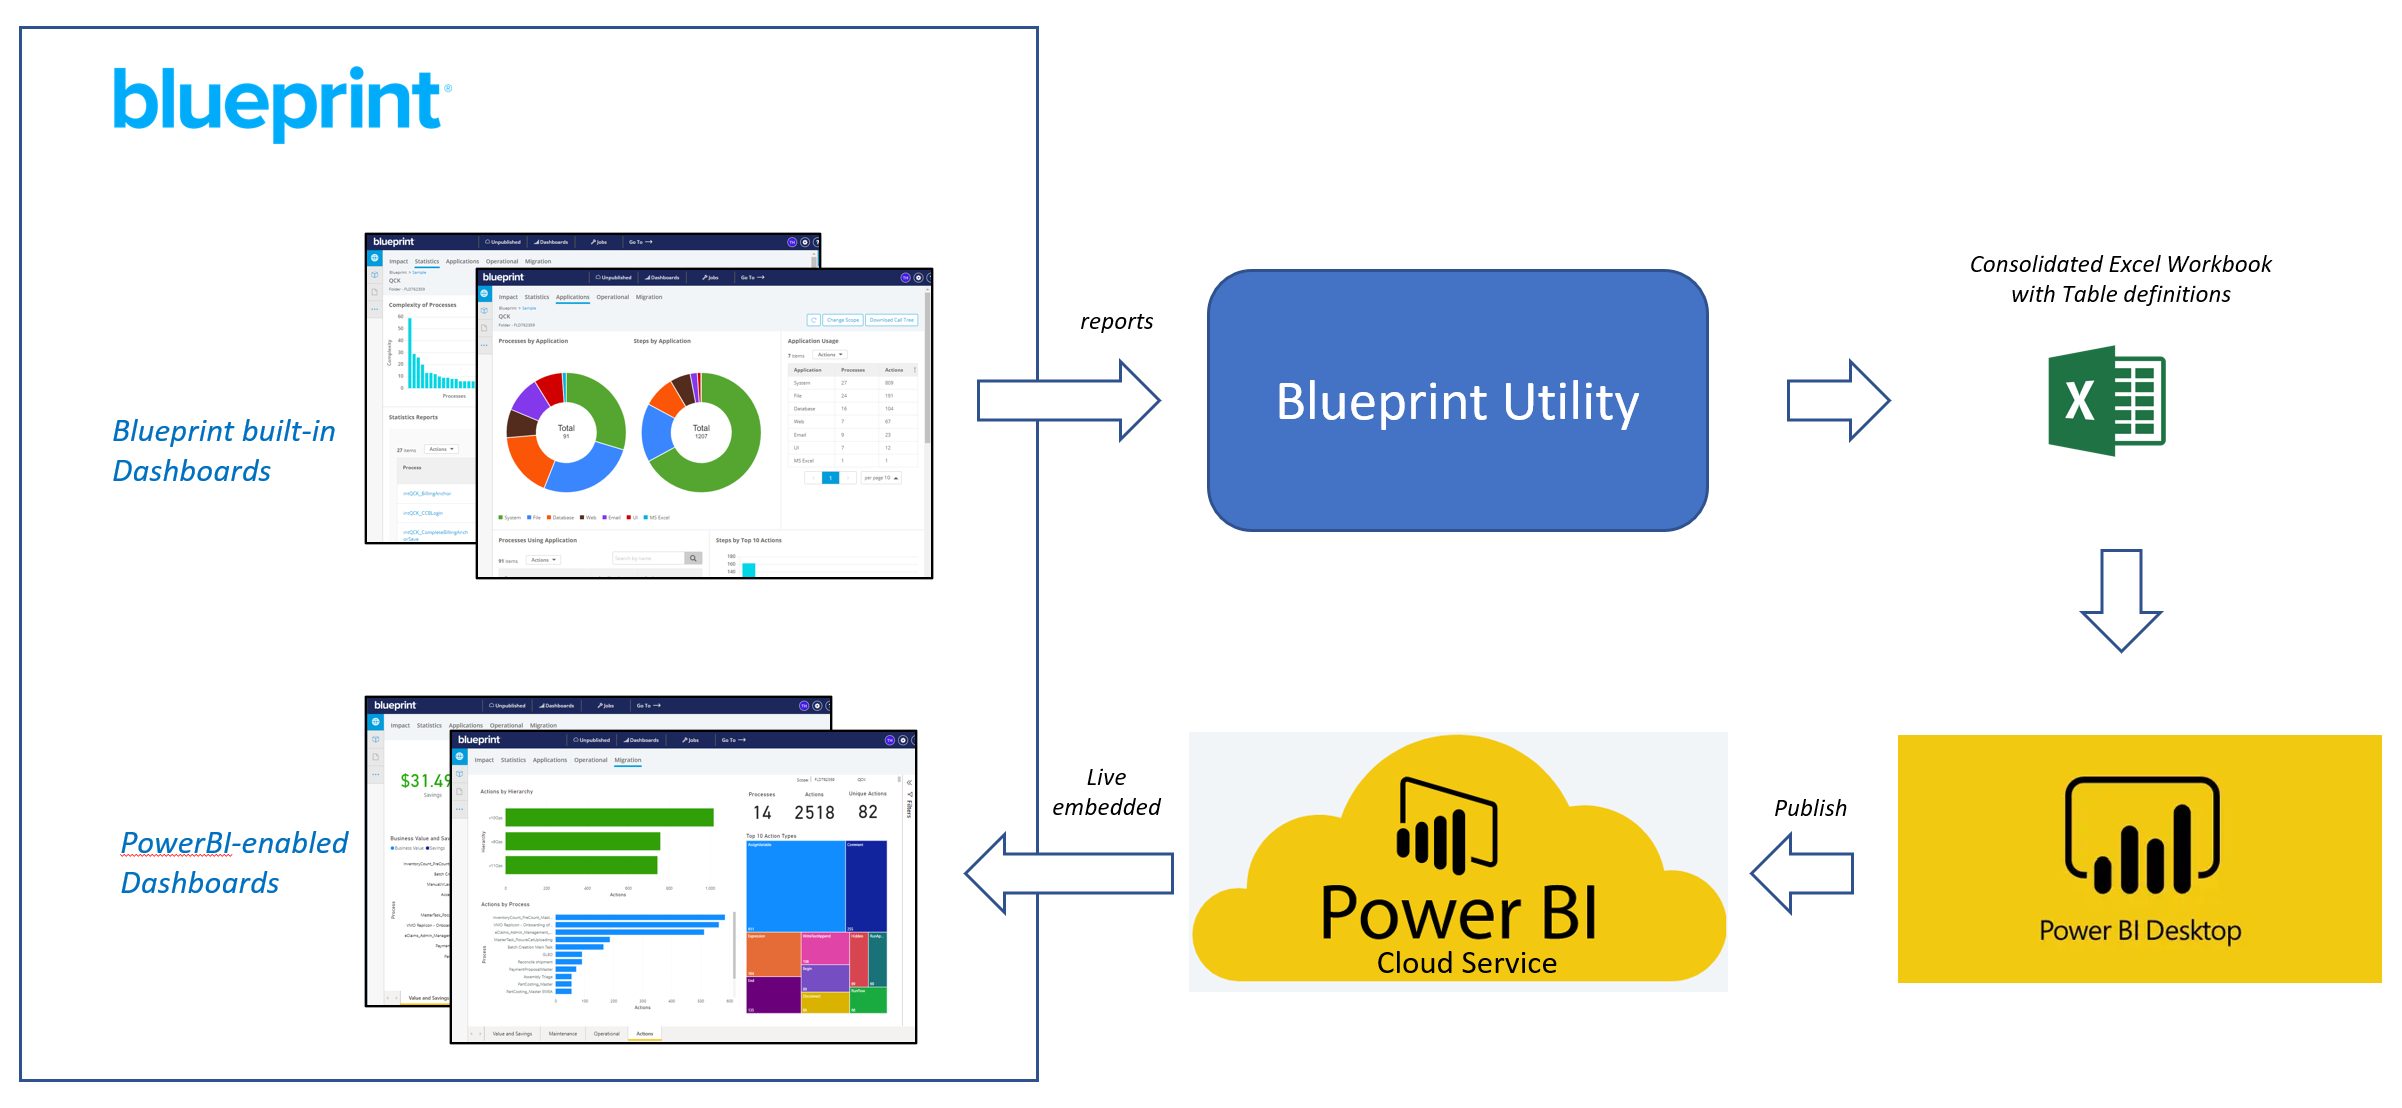
Once Step 1 above has been completed, users can then configure Blueprint to display the dashboards. The graphic below illustrates the flow of information to create the dashboards.
- Data for a selected Blueprint scope (i.e. Project or Folder within a project) is extracted from Blueprint using a Blueprint Utility and output to a spreadsheet.
- PowerBI desktop, using the provided project template, pulls data from the spreadsheet and automatically populates pre-defined dashboards which are then published to PowerBI cloud.
- When the Blueprint user opens the Custom dashboard in Blueprint, it presents the dashboards published to PowerBI cloud in the previous step
Use Blueprint Utility to Create Excel Workbook
- Run the Blueprint Utility. Enter the Blueprint URL and your credentials. Then enter the numeric ID of the project or folder whose data you want to export. Once the report has been generated, download the Excel file.
- Rename the Excel file to something relevant (e.g. "valuemapping data for project X")
- Open the Excel file and in the sheet "OperationalStatsArtifact" sheet, enter values into the two columns "Value per Hour" and "Maintenance Cost", then save, then close the workbook.
- Value per Hour: This is an estimate of how much business value in dollars is produced every hour the bot is run
- Maintenance Cost: This is an estimate of the maintenance cost in dollars of the bot for the time-window of operational data (e.g. week, month, quarter)
Use PowerBI Desktop to Create Dashboards to Cloud
- Download the PowerBI Template Project, rename if desired, then open the file in PowerBI Desktop
- In PowerBI Desktop select File -> Options and Settings -> Data Source Settings
- Click the Change Source button at the bottom and select the spreadsheet exported in Step 1. Click OK and then Close to dismiss the pop-up
- In the yellow bar that appears, choose Apply Changes. The spreadsheet will then be accessed and the data is refreshed. If successful, the pop-up will disappear when complete and the dashboards will reflect the new data
- In the ribbon, click the Publish button and follow the prompts to publish the report to PowerBI cloud
In the next section you'll configure Blueprint to display the dashboards you just published.
Configuring Blueprint to Display PowerBI Dashboards
First, Custom Dashboards must be enabled to display PowerBI dashboards within Blueprint.
- From Settings, expand RPA Management
- Select Migrate - Dashboards
- Choose the Custom tab and check the box for Enable Custom Dashboards
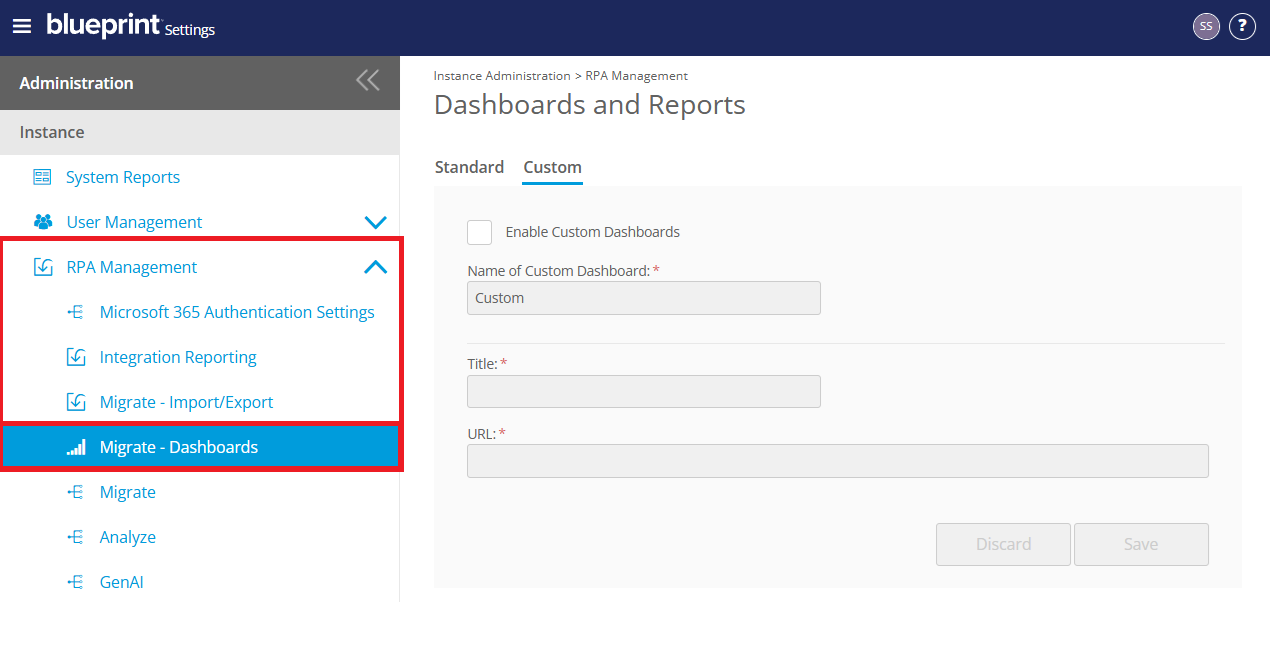
- Complete the fields displayed as follows:
- Name of Custom Dashboard: Enter a name that will appear as a label for dashboard selection in the user area
- Title: Enter a title for the dashboard. The title is only used internally by Blueprint to manage connections, the Title will not appear to end users.
- URL: Enter the URL of the PowerBI report. You can get this URL from PowerBI Cloud as follows:
- Open the PowerBI report that you wish to embed in Blueprint
- In the PowerBI report, Select File -> Embed report -> Website or portal
- Two values will appear. Copy the first one "Here's a link you can use to embed this content", and paste into the URL field in Blueprint
Once these setting have been configured properly, you should see an additional Dashboard in your user area that uses the name you entered in Name of Custom Dashboard.
Refreshing the Dashboards
The data in the dashboards can be refreshed as follows:
- Perform the steps in the above section, Use Blueprint Utility to Create Excel Workbook, to create an updated Excel workbook
- Rename the Excel file to the name you defined earlier in Use Blueprint Utility to Create Excel Workbook
- In PowerBI Desktop, open the same project as referenced earlier, and click Refresh in the top ribbon
- Once the refresh operation has completed, click Publish in the top ribbon and follow the prompts to publish the report to PowerBI cloud
To Access the Dashboard
- Choose RPA Dashboards and Reports in the main header
- Click the tab with the name of your custom dashboard
How did we do?
Call Trees
How to Create Microsoft Power Automate RPA Migration Estimates with Blueprint