Table of Contents
Features
This article provides a comprehensive overview of the Blueprint Analyze module’s features and navigation, from the interactive Home page to detailed sections on Ideas, Flows, Tools, Apps, Compliance, Opportunities, Reviews, Tests, Runs, Flow Activity, and Bulk Reporting. Each section explains how to access and interpret key metrics and actions to manage and optimize your imported RPA processes.

Analyze Home Page
While within the Analyze section of Blueprint, the Home Page can be accessed by clicking on the Blueprint icon in the top left.
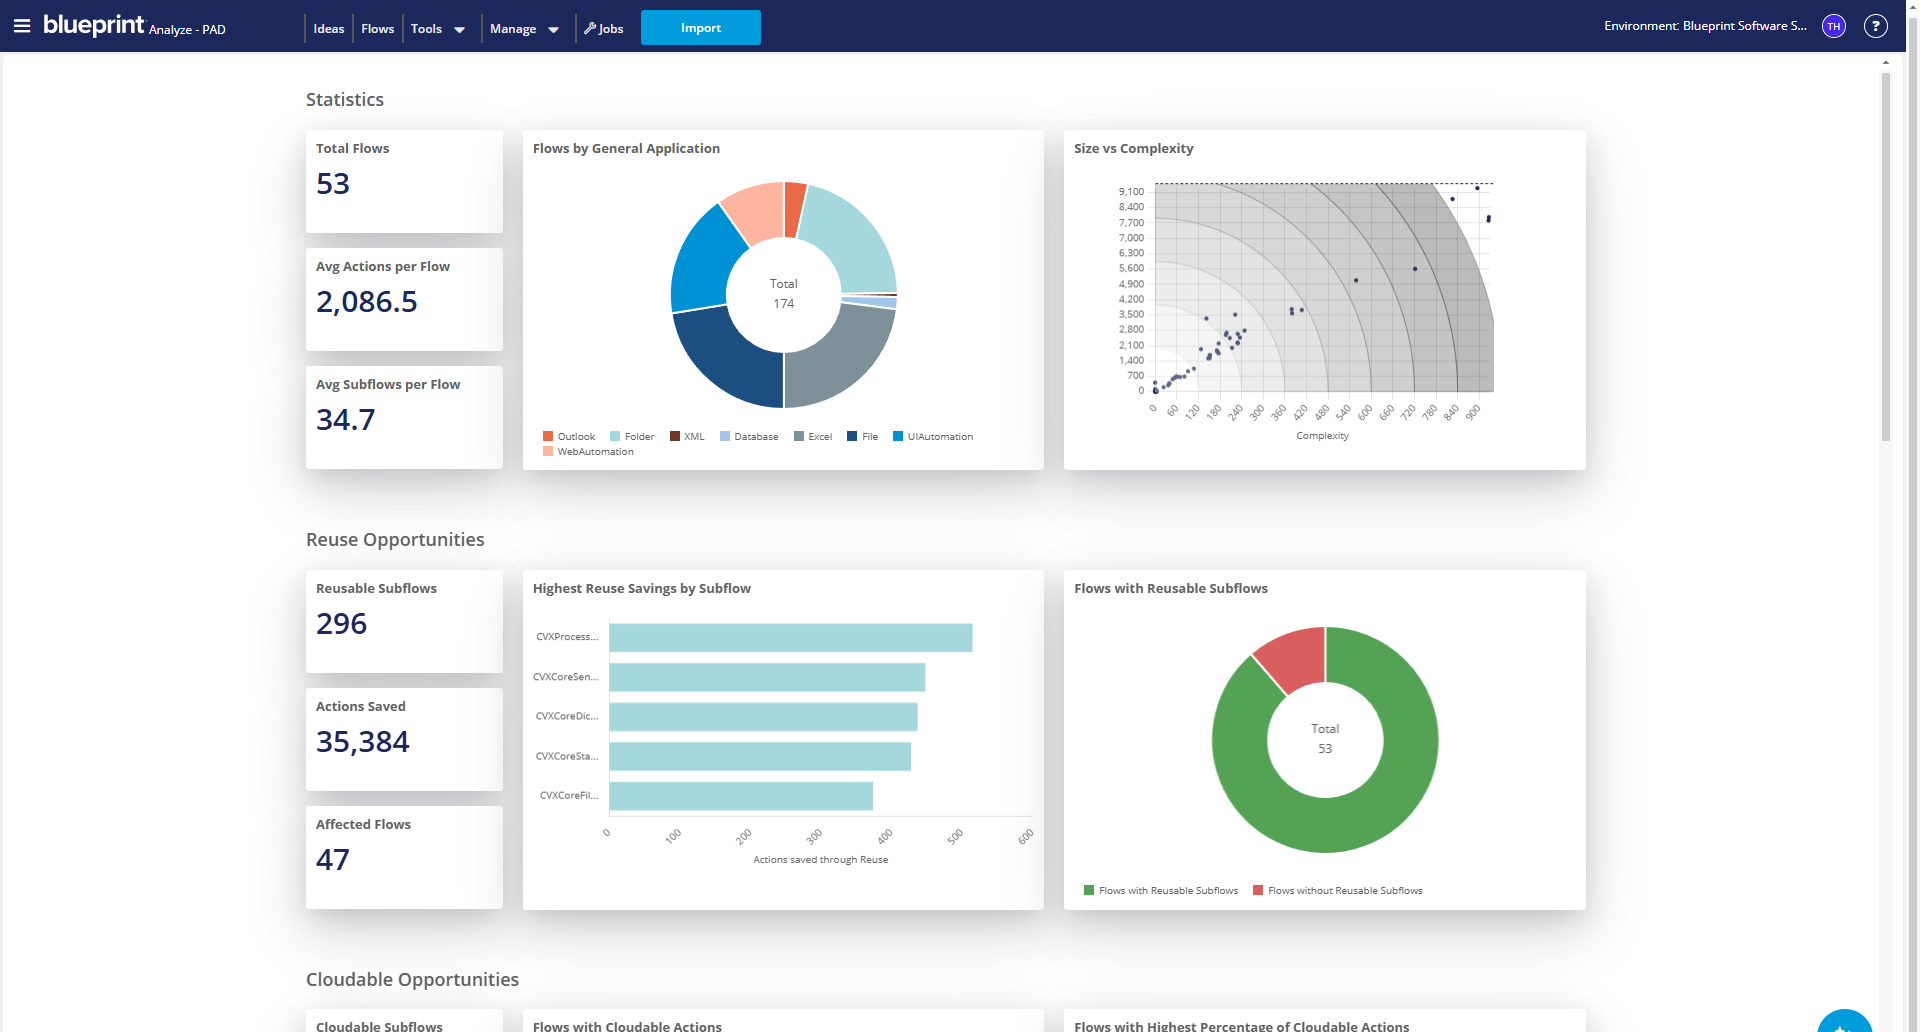
The Analyze Home page delivers an at-a-glance summary of your imported RPA processes via interactive charts. Click any segment to navigate directly to detailed views—such as Ideas, Flows, Tools, Compliance, or Bulk Reporting—to drill into metrics and take action.
Title Bar Navigation
Ideas (PAD Only) | Flows/Automations/Processes/Main Task Bots | Tools | Manage | Jobs | Import | Environment |
|
|
Ideas*
The Ideas page is your innovation hub—submit and track automation ideas in one place. Each idea captures viability scores, manual-cost metrics, and links to associated flows so you can rapidly validate and prioritize new automation opportunities.
Table Glossary
Name | Description |
Idea Name | The name of the Idea |
Created By | User who created the Idea |
Status | Status of the Idea |
Idea Score | The score of the current Idea. 100 being the most viable for automation, 0 being the least |
Total Processing Time (in hours) | How long it takes to do the current process manually |
Total FTEs | How many FTEs are required to do the current process manually |
Estimated Cost per year | Estimated cost to do the current process manually |
Last Updated | Last updated date of the Idea |
Last Updated By | Blueprint user who last updated the Idea |
Linked Flow | Flow linked to the current Idea |
How to Create Ideas
The Idea page serves as a the starting point for automation innovation, allowing users to submit idea for potential automations. This feature functions as both a process identification tool and a idea backlog repository, designed to accelerate RPA adoption across your organization by encouraging users to generate and share automation ideas.
- To create a new idea, click the Create button in the top right corner
- A modal will appear asking you to enter an idea Name and select a Department.
- Click Create
- You'll be navigated to the Idea page where you can add additional details. As you populate fields, Blueprint will generate an Idea Score and Manual Statistics (showing the current cost of manual processing, including Total Processing Time, Total FTEs Required, Estimated Current Cost per Year). For a more thorough evaluation of automation potential, it is strongly recommended that users complete the Specific Details section.
- Once all mandatory fields are filled, you can change the status by clicking Change Status. Status can be changed to and from any option - there is no predefined process flow that Ideas must follow.
- When Flow development begins, you can link the Flow to the Idea by clicking Link Flow.
- The Flow must be imported to Assess before it will appear in the Link Flow modal
- One Flow can have multiple linked Ideas, but each Idea can only link to one Flow
- You can see linked Ideas from the Details tab of a Flow. If ideas are linked, a new section will appear in the details tab called Linked Ideas.
Flows/Automations/Processes
Flows/Automations/Processes View
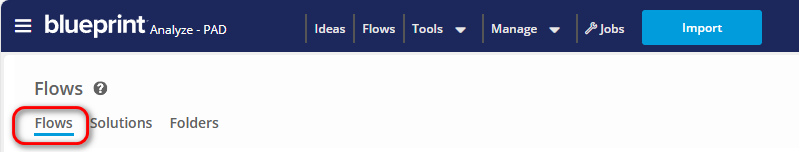
This section provides information on all individual imports to Blueprint Analyze.
- The terminology seen in the user interface is dependent on the RPA solution you are utilizing.
- Flows will be seen for Power Automate Desktop (PAD) processes.
- Automations will be seen for UiPath processes.
- Processes will be seen for Blue Prism processes.
- Main Task Bots will be seen for Automation360.
- Users can filter, enable, disable, and reorder columns in the table.
- If the user has set up their GenAI settings and the toggle is ON, another field called Find Processes with AI will appear on the left. Users can type in a natural language prompt to search for processes that meet specific criteria.
- To manage processes, select the desired processes using the checkboxes in the left column, click the Actions dropdown, and choose Delete to remove any processes you no longer wish to track.'
- The Actions dropdown can be used to manage processes. Select the desired processes using the checkboxes in the left column and click the Actions dropdown:
- Choose Delete to remove any processes you no longer wish to track
- Choose Bulk Report on Selected Flows and follow the wizard to generate reports on selected Flows
Table Glossary
Name | Description |
Indicators | Currently, four different kinds of indicators are supported:
|
[Flow/Automation/Process/Main Task Bot] | Name of the Flow/Automation/Process/Main Task Bot |
Subflow/Sub-Process/Page/Child Taskbot | Number of Subflows/Sub-Processes/Pages/Child Task Bots in the current process |
[Actions/Activities/Stages] | The number of [Actions/Activities/Stages] that exist in the current process |
Reuse | The total about of Exact Matches and Close Matches that can be turned into reusable components |
Cloudability | Percentage of actions in the Subflow/sub-process/page/child task bot that are cloudable |
Compliance | The number of Compliance violations found in the given process |
Applications | Number of Native and External applications the process interacts with |
Import Date | Date the process was imported into Blueprint Analyze |
Environment (PAD only) | PAD environment the Flow belongs to. If imported from a Solution file, "Solution File" will be displayed here |
Last Modified Date | Last modified date of the process |
Last Modified By (PAD only) | PAD user who last modified the process |
Tags | Tags applied to the current process |
Risk | Risk level of the current process |
Version (UiPath only) | Displays the UiPath version of the current process |
Folder (PAD only) | If a Flow is within a Folder, displays the folder/subfolder(s) the Flow is in |
Reimport*
Flows that have been imported to Blueprint Analyze via Microsoft Dataverse will have an additional option in the Actions dropdown called Reimport. If the user has set up their Dataverse Synchronization and Service Account Secret settings, Blueprint will be able to identify if the process has since been updated in the Indicators column.
To reimport and overwrite a process to select different GenAI features or update it to the latest version, simply choose a flow and select "Reimport" from the Actions dropdown. If a flow has the “Updated” icon, the newest version of the flow will be imported automatically.
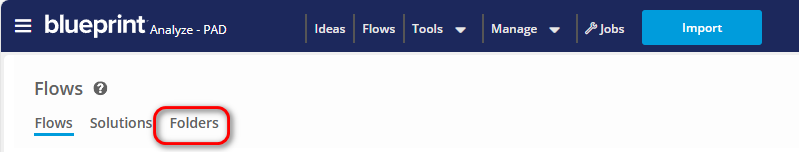
Folders View*
This is an alternate view from which to work with Flows in Blueprint. Instead of a flat list in the Flows View, here the Flows are in a folder hierarchy where they can be organized and managed.
Folder Pane
The Folder Pane on the left side of the Folder View displays your folder hierarchy. You can rearrange folders by dragging and dropping them.
There are four controls at the top of the pane:
- Search bar: Find any folder or subfolder. Matches are highlighted in the hierarchy
- New Folder: Launches a model where you can specify name and location of the new folder being created
- Rename Folder: Launches a modal where you can change the name of the currently-selected folder
- Delete Folder: Launches a modal asking confirmation to delete the currently-selected folder
By default, Flows not assigned to folders will be in the root of the folder hierarchy, which has the name of the Environment and cannot be changed.
When you select a folder, the flows within it are listed in the Flow Pane to the right.
Flow Pane
The Flow Pane displays details of Flows that are within the folder currently-selected in the Folders Pane on the left.
Overview:
The Folders View shows all flows that have been imported to Blueprint. Users can also Add flows that exist in Power Platform but not been imported. These flows are shown with non-clickable black font instead of blue-clickable font that is used for imported flows. By adding flows to the hierarchy Blueprint can be used to manage flows using folders, regardless of whether they've been imported.
Columns:
The Flows Pane has the following columns:
Checkbox | Used to select one or flows on which to perform an action |
Indicators | Indicators for the flow including whether changed in Power Platform |
Tags | Any user-assigned tags for the flow |
Flow | Name of the flow. If blue-clickable then the flow has been imported to Blueprint, and clicking will open its record in Blueprint. If black-nonclickable then the flow has been added to Blueprint. |
Import/Added Date | Date/time when the flow was imported or added to Blueprint |
Last Modified Date | Date/time when the flow was last modified in Power Platform |
Last Modified By | User who last modified the flow in Power Platform |
Actions:
When one or more flows are selected using the checkboxes, the actions drop-down menu becomes available. These are the available actions:
Delete | Deletes the selected flow(s) from Blueprint. Note: this does not affect the flow in Power Platform. |
Move | Launches a modal letting the user choose a folder to where the selected flows will be moved. |
(Re)Import | Launches a modal with import options. When user chooses Continue the flows will be imported from Power Platform. |
See flow in PAD | Launches the PAD Desktop Application letting the user edit the flow(s) |
Tools
The Tools menu centralizes bulk actions—generate reports, reimport PAD flows, delete processes, and manage tags—so you can perform high-volume operations from any feature page.
Apps
On the Apps page, review every native and external application your bots touch. Toggle between Native and External views by choosing the dropdown in the center, then rename apps or set organization-wide risk levels to feed compliance and governance reports.
Native Apps
Native Apps are applications that your RPA platform supports natively.
By default, Assess identifies all Native Applications accessed by any process within the instance. From this modal, users can click on an identified Native App to edit its name and assign a risk level for the accessed application.
Table Glossary
Name | Description |
Application | Application Name |
Risk | Assigned Risk of the current application |
[Flows/Automations/Processes/Main Task Bots] | Number of [Flows/Automations/Processes] that interact with the given application Click to display all processes that use application |
[Actions/Activities/Stages] | The number of [Actions/Activities/Stages] that interact with the given application |
External Apps
External Apps are applications that your RPA platform interacts with using generic actions (e.g., Run Application, Launch Browser). Some of these may overlap with Native App interactions.
By default, Analyze identifies all External Applications accessed by any process within the instance. From this modal, users can click on an identified External App to edit its name and assign a risk level for the accessed application.
Table Glossary
Name | Description |
Application | Application Name |
URL/Path | The URL or Path of the accessed application |
Risk | Assigned Risk of the current application |
Flows | Number of Flows that interact with the given application Click to display all processes that use application |
Actions | The number of Actions that interact with the given application |
Compliance - Violations
Compliance shows processes that breach your rules: view violation details like names, descriptions, thresholds, and severity levels. Click any entry to drill into non-compliant flows and update rules on the fly.
Table Glossary
Name | Description |
Name | Name of the Compliance Violation |
Description | Description of the Compliance Violation |
Thresholds | Threshold the process must meet to be considered compliant |
Severity | How important the Compliance Violation is to your organization |
Non-Compliant [Flows/Automations/Processes/Main Task Bots] | Number of [Flows/Automations/Processes/Main Task Bots] with Compliance Violations Click to display all non-compliant processes |
Compliance Management
The Compliance Management modal enables users to set up customizable rules their processes must follow in order to be compliant. "Disabled Compliance Rules will display with a Disabled icon ( ) and shaded in gray.
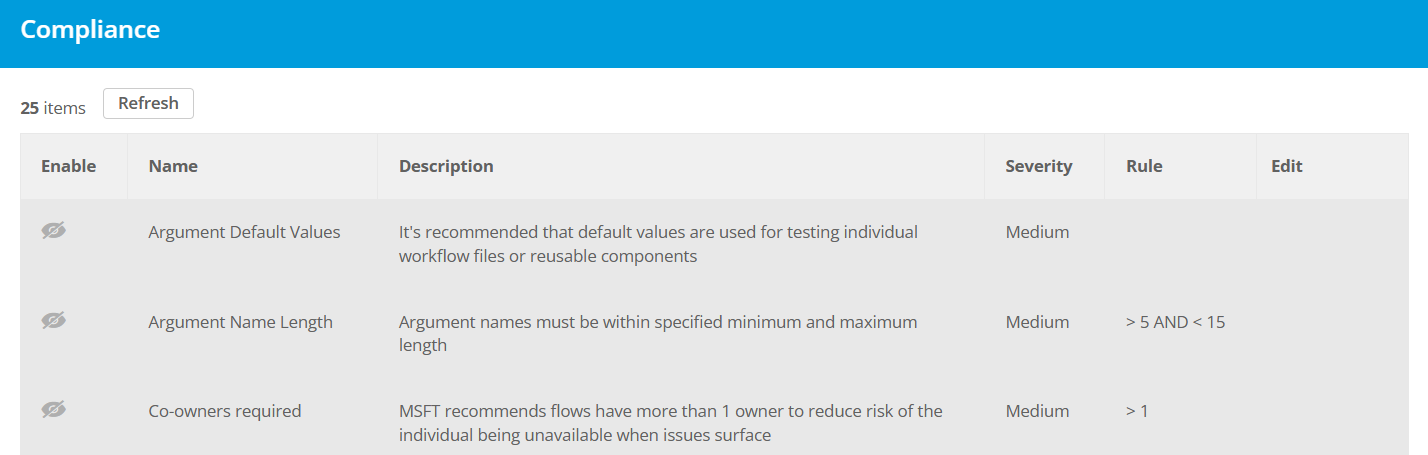
Table Glossary
Name | Description |
Enable | To enable a rule, click the eye icon in the enable column |
Name | The name of the rule. Read only |
Description | The description of the rule. Read only |
Severity | The severity of the compliance violation |
Rule | The rule defines the threshold the process must meet in order to be considered compliant. i.e., Flow Action Count with the Rule "< 1000" means that Flows must contain less than 1000 actions, or they are considered non-compliant Note - Rule thresholds cannot be modified for rules that are True/False |
Edit | Click to bring up a modal to edit the current rule. |
Opportunities
Opportunities surfaces reuse and cloud-migration wins. On Reusability, see top-savings subflows; on Cloudability, highlight processes above your threshold. Click any card or table row to generate targeted improvement plans. To switch between Reusability and Cloudability, click the dropdown in the center.
Reusability
Card Glossary (Left)
Name | Description |
Reusable [Subflows/Sub-Processes/Pages/Child Task Bots] | Number of Subflows we recommend to be reused, either because they are exact duplicates or very close |
[Flow/Automation/Process/Main Task Bot] [Action/Activity/Stage] Savings | The total number of actions in the flow could be reduced if reuse is implemented |
Estate [Action/Activity/Stage] Savings | The number of actions the estate could be reduced if reuse is implemented |
Graph Legend (Right)
Highest Reuse Savings by [Subflow/Sub-Process/Page/Child Task Bot] | Top 5 [Subflows/Sub-Processes/Pages/Child Task Bots] with highest amount of savings that can be achieved through reuse |
All Reuse Opportunities - Table Glossary (Bottom)
Name | Description |
[Flow/Automation/Process/Main Task Bot] Name | Name of the process |
[Subflow/Sub-Process/Page/Child Bot] | Name of the sub-process |
[Actions/Activities/Stages] | Number of matching actions |
Matching [Flows/Subflows Automations/Sub-Processes Processes/Pages Main Task Bot/Child Task Bot] | Number of [Subflows/Sub-Processes/Pages/Child Task Bots] that are a reuse match to the current sub-process. Can be clicked to see list of all matches |
Max [Actions/Activities/Stages] Savings | The total number of [Actions/Activities/Stages] the [Flow/Automation/Process/Main Task Bot] could be reduced by if reuse is implemented |
Cloudability
User can definite a Cloudability Threshold setting in Settings > Analyze > Analyze Settings > General Settings.
Analyze will display Cloudability metrics for all processes, but those that surpass the defined Cloudability Threshold will be highlighted in the charts and table for added visibility.
Card Glossary (Left)
Name | Description |
Cloudability | Percentage of Cloudable actions |
Cloudable [Subflows/Sub-Processes/Pages] | Number of Subflows whose Cloudable percentage exceeds the CloudableThreshold (Release 7.6) |
Cloudable [Actions/Activities/Stages] | Number of actions in the flow that are Cloudable |
Graph Legend (Right)
Cloudability of Largest [Subflows/Sub-Processes/Pages/Child Task Bots] | Top 5 [Subflows/Sub-Processes/Pages/Child Task Bots] with highest amount of Cloudability |
All Cloud Opportunities - Table Glossary (Bottom)
Name | Description |
[Flow/Automation/Process/Main Task Bot] Name | Name of the process |
[Subflow/Sub-Process/Page/Child Task Bot] | Name of the sub-process |
[Actions/Activities/Stages] | Number of matching actions |
Cloudable [Actions/Activities/Stages] | Number of actions in the flow that are Cloudable |
Cloudability | Percentage of Cloudable actions |
Applications | Native Applications interacted with in the sub-process. |
Reviews
Reviews shows every process-level review and its current status. Toggle off ‘My Reviews’ to see organization-wide assignments, then click any process to update review outcomes or reassign reviewers.
Tests
Tests lists manual, automated, and AI-generated test cases across your bot estate. View status, type, and environment, then create, edit, or disable tests to maintain coverage and quality.
Table Glossary
Name | Description |
Test | Name of the Test |
Test Status (PAD Only) | Only applicable for Automated Tests. Displays whether the Test is ON or OFF |
Type | Displays the type of Test (Automated, Manual, or AI Generated Manual) |
Creation Date | Date the Test was created. Can be modified by clicking the Test value and manually adding a description. |
Description | Displays a custom description for the current Test. This must be entered manually by clicking the Test value. |
Environment (PAD Only) | Only applicable for Automated Tests. Displays the PAD environment the Automated Test runs in |
Test Runs | Number of Runs the Test has performed |
Latest Run | Status of Latest Run (Succeeded, Failed, Not Available) |
[Flow/Automation/Process/Main Task Bot] | The [Flow/Automation/Process/Main Task Bot] being Tested |
Test Runs
Test Runs presents execution results for every test case: see success/failure counts, durations, and error messages. Filter by process or date range to troubleshoot and track quality over time.
Table Glossary
Name | Description |
[Flow/Automation/Process/Main Task Bot] | Name of the process |
Result | Result of the test (Succeeded, Failed) |
Case (PAD Only) | Only applicable for Automated Tests. If Failed, displays the specific Test Case that failed |
Test | Name of the Test |
Type | Displays the type of Test (Automated, Manual, or AI Generated Manual) |
Start | Start datetime of the Run |
PAD/UiPath/Blue Prism/Automation360 Last Modified Date (PAD Only) | Last modified Date of the PAD Flow |
Owner (PAD Only) | Owner of the PAD Flow |
Coverage (PAD Only) | Only applicable for Automated Tests. Percentage that displays the total actions in the flow that were executed in the Test Run |
Environment (PAD Only) | Only applicable for Automated Tests. Displays the PAD Environment the Automated Test runs in |
Log (PAD Only) | Only applicable for Automated Tests. Click to see a sequential list of all actions that executed in the current Run. Also displays if the action has an associated Assert, and if the Assert Succeeded or Failed |
Successful Asserts (PAD Only) | Only applicable for Automated Tests. Displays the total number of Successful Asserts for the given Run |
Failed Asserts (PAD Only) | Only applicable for Automated Tests. Displays the total number of Failed Asserts for the given Run |
Not Executed Asserts (PAD Only) | Only applicable for Automated Tests. Displays the total number of Asserts that did not execute for the given Run |
Flow Activity*
Flow Activity delivers live PAD-execution insights: total runs, success and failure rates, CPU and memory usage, and anomaly flags. Select custom time windows to surface performance trends and pinpoint bottlenecks.
Card Glossary
Name | Description |
Total Flows | Total Flows that have run data in the connected environment |
Total Runs | Total Runs of all Flows |
Total Successful Runs | Number of Successful Runs |
Total Failed Runs | Number of Failed Runs |
Chart Glossary
Name | Description |
Total 5 Failed Flows | Total 5 failed Flows. User can hover to see more details. |
Total 5 Errors | Displays the top 5 most common errors. User can hover to see more details. |
Top 5 Queued Flows Duration | Displays the top 5 flows sorted by time spent in status Queued |
Top 5 Flows by Execution Duration | Displays the top 5 flows sorted by execution duration |
Top 5 Flows by CPU | Displays the top 5 Flows by CPU usage |
Top 5 Flows by Memory | Displays the top 5 Flows by Memory usage |
Table Glossary
Name | Description |
Anomaly | For a given flow, certain metrics are considered anomalous if they are +/- 3 standard deviations away from the mean. If a run has 1 or more anomalous behavior found, this flag appears. |
Flow | Name of the Flow |
Start | Datetime the run started |
Status | Status of the run (Succeeded, Failed) |
Error Rate | The number of Failed Runs divided by Total Runs for the Period |
Duration | Sum of Queue Time + Execution Time |
Queued Duration | Time the flow spent in status Queued |
Execution Duration | Total time for the Flow to execute |
CPU | CPU usage |
Memory | Memory Usage |
Error List | If Failed, displays the error message |
Machine | Machine that ran the Flow |
Last Modified | Last Modified Date of the Flow |
Mode | Mode of the Flow Run (Attended, Unattended, Local) |
Dependencies*
The Dependencies page provides an instance wide view of every flow dependency in one place.
Each row in the table displays a unique dependency for the Calling Flow. Flows with no dependencies are excluded from the table entirely.
Table Glossary
Name | Description |
Calling Flow | The name of the Flow that has the dependency. Click to open the Flow in a new tab |
Dependency | The name of the Flow or queue that the Calling Flow depends on |
Dependency Type | Indicates whether the Called Object is a Desktop Flow or a Queue |
Calls | The number of times the Calling Flow calls the Dependency |
Bulk Reporting
Bulk Reporting lets you export any Analyze table—Flows, Ideas, Opportunities, and more—as one or many reports. Click Export Reports, choose your tables, then track the job in Jobs; completed exports appear with download links.
- Click the Export Reports button on the top right and select the report(s) you want to export. This will submit a job that you can monitor on the Jobs page.
- Once the job is complete, you can download your report(s) by clicking the download icon next to the completed job.
Manage
Tags
The Tags Management modal enables users to create custom tags that can be applied to any process.
- To create a tag: Click the Create button in the top right corner and follow the prompts to create your tag.
- To delete a tag: Select the tags you wish to delete using the checkboxes on the left, then click the Action dropdown and choose Delete.
- To edit a tag: Click the pencil icon next to the tag name.
- To view associated processes: Click the tag name to see all processes assigned to that tag.
Environments
Blueprint currently supports connectivity to one Power Automate Environment and a separate Solution Files Environment. To switch between them, click the Environment name in the title bar to open a dropdown of available environments.
How did we do?
AI Navigator
Process Details