Table of Contents
- Process Tabs
- Header Options
- Details
- Subflows/Sub-Process/Pages/Child Task Bot
- Apps
- Diagrams
- Compliance
- Opportunities
- Find and Replace (Analyze - PAD only)
- Reviews
- Tests
- Test Runs
- Flow Activity (Analyze - PAD only)
- Changes (Analyze - PAD only)
Process Details
This article explains the Process Tabs interface in Blueprint Analyze, beginning with the Details tab and showing how to access related views like Diagrams, Compliance, Opportunities, Tests, Flow Activity, and more. It also covers header actions—specification export, “See Flow in PAD,” bulk reporting, and agent integration—and details how to use custom content, risk metrics, and version controls. Use this guide to navigate each tab’s functionality and manage your imported RPA processes effectively.

- Process Tabs
- Header Options
- Details
- Subflows/Sub-Process/Pages/Child Task Bot
- Apps
- Diagrams
- Compliance
- Opportunities
- Find and Replace (Analyze - PAD only)
- Reviews
- Tests
- Test Runs
- Flow Activity (Analyze - PAD only)
- Changes (Analyze - PAD only)
Process Tabs
When you select a process in Blueprint Analyze, the Details tab opens first—offering links to all related tabs (Diagrams, Compliance, Opportunities, Tests, Flow Activity, etc.) so you can drill into every aspect of that process.
Header Options
In the top right corner of the screen, you'll find an Actions dropdown menu where you can perform various tasks:
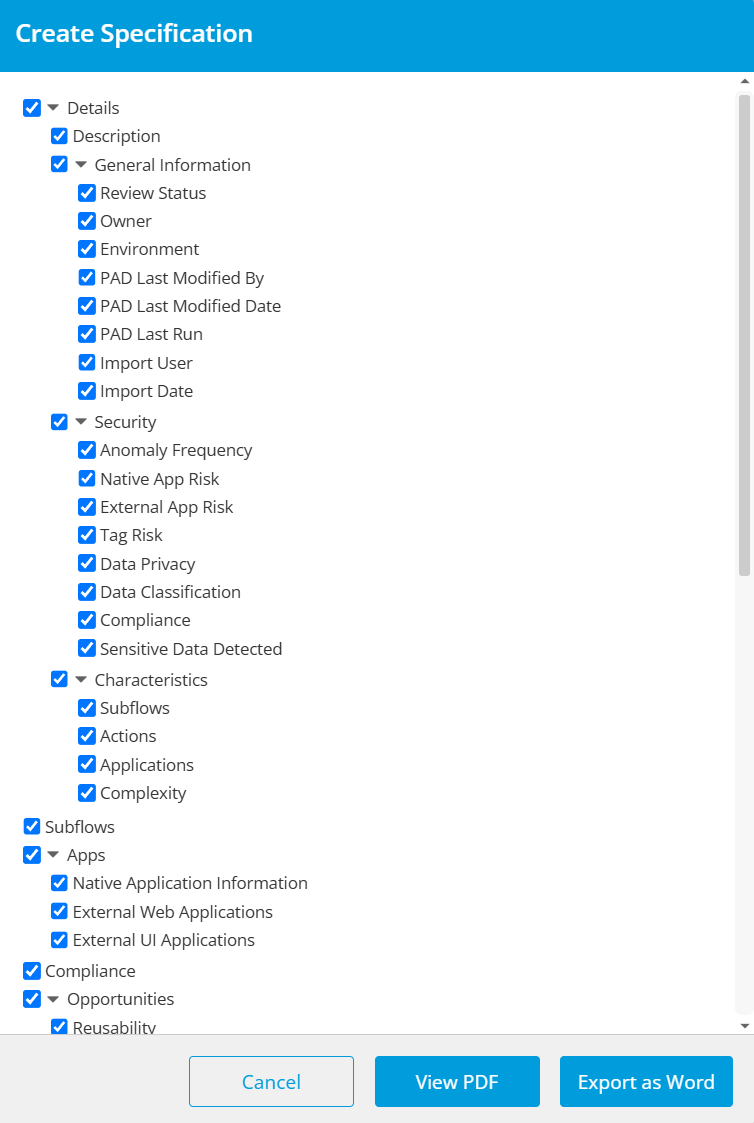
Create Specification
Users can summarize all information about a process in Assess as an exportable document, similar to a PDD or SDD.
- Click Create Specification button on the top right and select the pieces of information you wish to include.
- You can also drag and reorder items to organize the content as desired.
- Select View PDF for a flat file or Export to Word to make additional changes to the document.
See Flow in PAD
For Flows imported from Dataverse, users will have an additional "See Flow in PAD" button. This feature allows users to open the current PAD Flow directly from Blueprint.
Export Reports
Users can export any table related to the [Flow/Automation/Process/Main Task Bot] they are currently viewing.
- Click the Export Reports button on the top right and select the report(s) you want to export. This will submit a job that you can monitor on the Jobs page. Once the job is complete, you can download your report(s) by clicking the download icon next to the completed job.
Add to Agent
This feature makes Power Automate Desktop Flows available to Copilot Agents to perform work. For more information, please reference Adding PAD Flows to Copilot Agents.
Details
On the Details tab, view a comprehensive summary of this process, organized into sections—Overview, Diagrams, Compliance, Opportunities, Tests, Flow Activity, and more—for efficient navigation.
General Information
Name | Description |
Review Status | Review Status for the process |
Last Modified Date | Date the process was last modified |
Import User | User who imported the process |
Import Date | Datetime the process was imported |
Parent Process | For PAD only, this is only for visible if the process was imported via Solution file, and displays the solution it belongs to |
Import FileName | If import was via file, displays the full file name |
File/URL | For A360 only, displays if the A360 Taskbot was imported via file or API |
Migrate Link | If "Also Import to Analyze" was enabled during an RPA file import, a link to the corresponding process in Migrate will appear here. See RPA Imports to Blueprint for more information. |
PAD - Additional Information (if imported from Dataverse)
Name | Description |
Owner | Owner of the PAD Flow |
Environment | Displays the PAD Environment the Flow originated from |
PAD Last Run | Datetime of the last Run in the PAD environment |
Security
Name | Description |
Anomaly Frequency (PAD Only) | Displays the number of Anomalies found in Flow Runs within the applied Anomaly Time Frame (See Settings and Configuration - Power Automate Desktop) |
Compliance | Displays the number of Compliance violations for the process |
Native App Risk | Displays the top 3 highest risk Native Apps that the Flow accesses. Native App Risk can be modified from the Title Bar > Manage dropdown > Native Apps (See Features - Native App Risk) |
External App Risk | Displays the top 3 highest risk External Apps that the Flow accesses. External App Risk can be modified from the Title Bar > Manage dropdown > External Apps (See Features - External App Risk) |
Tag Risk | Displays the top 3 highest risk Tags that the Flow accesses. Tag Risk can be modified from the Title Bar > Manage dropdown > Tags (See Features - Tag Risk) |
Data Privacy | Users can select any kind of sensitive data that the process accesses |
Data Classification | Users can select the Data Classification level of the process |
Sensitive Data Found ( | This item appears only if the user has set up their GenAI settings and the toggle is ON. If Sensitive Data is found, click to view which subprocesses are accessing which specific types of sensitive data. |
Characteristics
Name | Description |
[Subflows/Sub-Processes/Pages/Child Task Bots] | Displays the number of sub-processes that the current process references |
[Actions/Activities/Stages] | Displays the number of actions in the current process |
Applications | Displays the number of applications in the current accesses |
Complexity | This is the Cyclomatic Complexity of the process. Refer to Cyclomatic complexity - Wikipedia. |
Custom and Legacy Content
This section allows users to add any information that may not have been captured during the import to Analyze.
- To add new information, click the Add New button in the top right. Users can name the Additional Information section and include any rich text description they like.
- To add existing legacy documentation, click the Import Document button in the top right. This will allow users to import any word document. Each document section will appear as a new row in the Custom and Legacy Content section.
- Document sections will appear in the table in the same order they exist in the document
- Descriptions of the sections will be in rich-text in the side-panel editor
- Fonts, tables, images, and other rich text elements will appear as they were in the original document
Dependencies (Analyze - PAD Only)
The Flow Dependencies table shows when your Flow calls an external Desktop Flow or references a queue. Use this to identify what your Flow depends on and where those dependencies occur in your code.
Table Glossary
Name | Description |
Name | The name of the external Desktop Flow being called |
Type | The dependency type (e.g., "Flow", "Queue", or "Environment Variable" for Desktop Flows) |
Calling Subflows | The number of subflows within your current Flow that call this dependency. Click the number to see which subflows make the call, how many times, and at which step numbers. |
Actions | The total number of actions in this Flow that call this dependency, either via a Run Desktop Flow action or a work queue reference |
Tags
Users can apply existing tags to the current process by clicking the Tags field and selecting from the available options.
Description
If configured and enabled, Process Descriptions are automatically generated using GenAI. Users can choose to edit the Description if needed.
Subflows/Sub-Process/Pages/Child Task Bot
This page provides high level details to all sub-processes that are called by the current process.
Table Glossary
Name | Description |
Subflow/Sub-Process/Page/Child Task Bot | Name of the Sub-Process |
Reuse | Display if Reuse Opportunities are available for this Sub-Process |
Cloudability | Displays how Cloudable the current Sub-Process is as a percentage Can be clicked to see all cloudable actions in the process |
[Actions/Activities/Stages] | Displays the number of actions in the Sub-Process |
Applications | Displays the number of applications the Sub-Process access |
Risk | Displays the assigned risk level of the Native App. The risk level can be modified by navigating to the Title Bar > Management dropdown > Native Apps. (See Features - Native App Risk) |
Sensitive Data | This column can only contain values if the user has set up their GenAI settings and the toggle is ON. If Sensitive Data is found, a "Yes" will be displayed. Otherwise, the column will be blank |
Description | Click View to see the existing AI description or generate a new one |
Apps
Within the Apps tab, users can view information on Native and External applications accessed by the current process. To switch between Native Application Information and External Web/UI Applications, click the dropdown in the center.
Native Apps
The Native Apps tab lists every application with first-class integrations—displaying connector types, version details, and usage statistics for streamlined governance and support.
Native Application Information - Table Glossary
Name | Description |
Application | Name of the Native Application accessed |
Risk | Displays the assigned risk level of the Native App. The risk level can be modified by navigating to the Title Bar > Management dropdown > Native Apps. (See Features - Native App Risk) |
Application Details | Displays various additional details for the given app |
Actions | Displays the number of actions that interact with the given app |
External Apps
The External Apps tab catalogs all applications invoked by your bots via generic actions—such as Run Application or Launch Browser—and identifies overlaps with native connectors. Click an entry to rename it for clarity or assign a risk level for compliance reporting.
External Application Information - Table Glossary
Name | Description |
Custom Name | Displays the app's custom name. This must be entered manually by clicking the Web/UI Application value and providing the current version. This is useful when the app name found in the path does not indicate its specific purpose. |
Web/UI Application | Displays the name of the web/UI application found in the URL or path. Click this value to add details, such as a Custom Name, Application Version, and any extra information in the Notes. |
Risk | Displays the assigned risk level of the External App. The risk level can be modified by navigating to the Title Bar > Management dropdown > Native Apps. (See Features - External App Risk) |
Version | Displays the version of the app. This must be entered manually by clicking the Web/UI Application value and providing the current version. |
URL/Path | Full URL/Path that accesses the given Web/UI application |
[Subflow/Sub-Process/Page/Child Task Bot] | Displays the name of the [Subflow/Sub-Process/Page/Child Task Bot] that accesses the current application |
Line (PAD Only) | Displays the PAD line number that interacts with the current application |
Notes | Displays any Notes the user would like to see. This must be entered manually by clicking the Web/UI Application value and providing the current version. |
Diagrams
The Diagrams tab offers two distinct visualizations for your process:
- Structure Diagram: This high-level workflow map displays each action in sequence, complete with clickable shapes revealing action details and AI summaries. Users can further refine it using the Business Process Model and Notation (BPMN) Shape Library or manual edits, which persist across reimports.
- Generated automatically on each import, with or without GenAI, depending on your instance settings.
- Process Diagram: An expandable call-tree chart outlining every subprocess, annotated with complexity color bars and legends for reuse frequency, missing references, and depth. Clicking nodes reveals metrics like action count, applications, cloudability/reuse scores, risk level, and sensitive data flags.
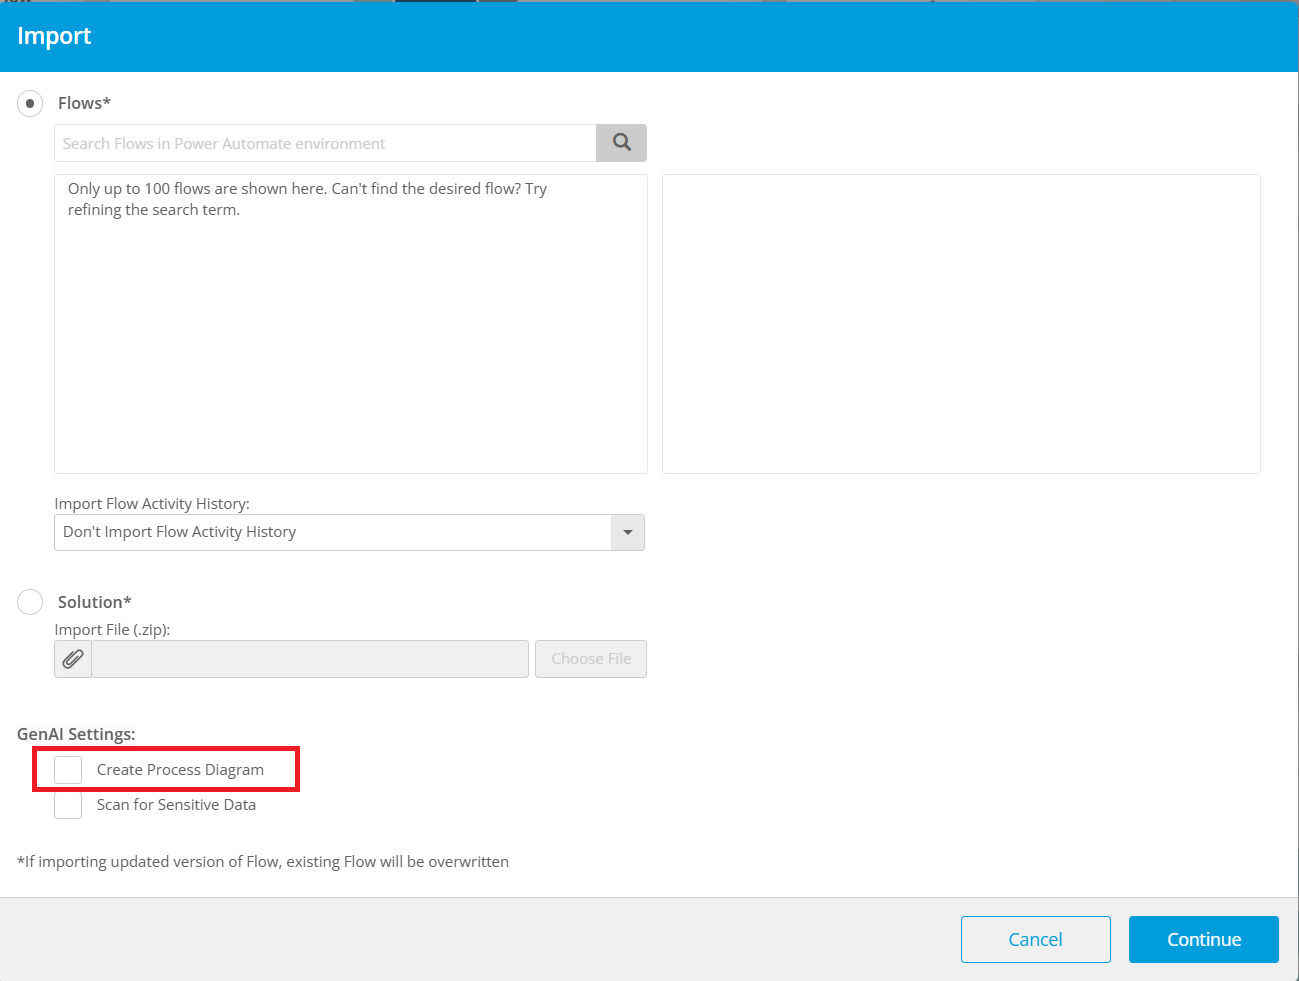
- To generate this view, enable the Include Process Diagram option during import.
Structure Diagram Details and Key Features
- Automatically generated call-tree on import.
- Visualizes parent-subprocess relationships with expandable/collapsible branches.
- Search functionality to quickly find specific subprocesses in the diagram.
- Ability to collapse duplicate reused subprocesses.
- Complexity color-bars indicate process depth and intricate areas.
- Legends denote reuse frequency and missing subprocess references.
- Click any node to view detailed metrics (action count, application usage, cloudability/reuse scores, risk level, sensitive-data flags).
- Center on Root button focuses on the main process for easier navigation.
- Ability to export diagram as .png or .svg via the Export dropdown
Process Diagram Details and Key Features
- AI Generated Diagram – A high-level process diagram. Requires the user has set up GenAI and it is enabled (See Settings and Configuration - GenAI)
- Blueprint Generated Diagram – a technical, developer-focused diagram that lays out low-level process constructs, including system activities, variable flows, and API calls. This diagram can serve as a precise reference for troubleshooting and code review, complementing the high-level Structure and Process diagrams.
- Detailed workflow map created at import, displaying each action in sequential order.
- Clickable nodes reveal AI-generated summaries, action metadata (duration, parameters), and source links.
- Interactive BPMN Shape Library allows drag-and-drop addition of tasks, events, gateways, and connectors.
- Manual edits and annotations (labels, colors) persist across reimports.
- Supports export to standard BPMN or image formats for documentation and stakeholder sharing.”
Compliance
The Compliance tab displays information on all compliance violations for the current process.
Table Glossary
Name | Description |
Name | Name of the Compliance Violation found |
Description | Description of the Compliance Violation |
Threshold | The threshold that must be met for the process to be considered as compliant |
Severity | Severity of the Compliance Violation |
Opportunities
The Opportunities tab displays potential opportunities for reuse or cloud transformation in the current process. To switch between Reusability and Cloudability, click the dropdown in the center.
Reusability
There are 2 kinds of reuse matches that Blueprint can identify:
- Close Match: Same actions in the same sequence, but flexible on details like variable names, comments, and parameter values. Think of it as functional reuse - the workflow does the same thing the same way, even if the specifics vary.
- Exact Match: Everything must be identical - actions, order, variables, comments, parameters, default values, etc. This is literal reuse where the code blocks are functionally interchangeable with no modifications needed.
In both cases, the all actions and their order must match exactly
Card Glossary (Left)
Name | Description |
Reusable [Subflows/Sub-Processes/Pages/Child Task Bots] | Number of Subflows we recommend to be reused, either because they are exact duplicates or very close |
[Flow/Automation/Process/Main Task Bot] [Action/Activity/Stage] Savings | The total number of actions in the Flow could be reduced if reuse is implemented |
Estate [Action/Activity/Stage] Savings | The number of actions the estate could be reduced if reuse is implemented |
Graph Legend (Right)
Highest Reuse Savings by [Subflow/Sub-Process/Page/Child Task Bot] | Top 5 [Subflows/Sub-Processes/Pages/Child Task Bots] with highest amount of savings that can be achieved through reuse |
All Reuse Opportunities - Table Glossary (Bottom)
Name | Description |
[Subflow/Sub-Process/Page/Child Bot] | Name of the sub-process |
[Actions/Activities/Stages] | Number of matching actions |
Matching [Flows/Subflows Automations/Sub-Processes Processes/Pages Main Task Bot/Child Task Bot] | Number of [Subflows/Sub-Processes/Pages/Child Task Bots] that are a reuse match to the current sub-process. Can be clicked to see list of all matches |
Max [Actions/Activities/Stages] Savings | The total number of [Actions/Activities/Stages] the [Flow/Automation/Process/Main Task Bot] could be reduced by if reuse is implemented |
Cloudability
User can definite a Cloudability Threshold setting in Settings > Analyze > Analyze Settings > General Settings.
Analyze will display Cloudability metrics for all processes in the current Flow/Automation/Process/Main Task Bot, but those that surpass the defined Cloudability Threshold will be highlighted in the charts and table for added visibility.
Card Glossary (Left)
Name | Description |
Cloudability | Percentage of Cloudable actions |
Cloudable [Subflows/Sub-Processes/Pages] | Number of Subflows whose Cloudable percentage exceeds the CloudableThreshold (Release 7.6) |
Cloudable [Actions/Activities/Stages] | Number of actions in the Flow that are Cloudable |
Graph Legend (Right)
Cloudability of Largest [Subflows/Sub-Processes/Pages/Child Task Bots] | Top 5 [Subflows/Sub-Processes/Pages/Child Task Bots] with highest amount of Cloudability |
All Cloud Opportunities - Table Glossary (Bottom)
Name | Description |
[Subflow/Sub-Process/Page/Child Task Bot] | Name of the sub-process |
[Actions/Activities/Stages] | Number of matching actions |
Cloudable [Actions/Activities/Stages] | Number of actions in the Flow that are Cloudable |
Cloudability | Percentage of Cloudable actions |
Applications | Native Applications interacted with in the sub-process. |
Find and Replace (Analyze - PAD only)
The Find and Replace tab allows users to find and replace any Find and Replace lets you make bulk edits to the Robinscript in your PAD Flows. You can either search and replace specific text across your Flow, or select entire actions and replace them with new Robinscript
How Find and Replace Stays Current
Find and Replace always works with the most recent version of your Flow, regardless of your versioning type selected in Blueprint or save type selected in PAD. Along with Flow Activity, this feature updates automatically without requiring a manual reimport.
Requirements
Find and Replace requires a valid Microsoft 365 Authentication Setting to be configured in Blueprint. If one is not configured, the page will be inaccessible and an error message will be displayed.
Find and Replace works primarily with Flows imported via Dataverse. For Flows imported via Solution File: if the Flow exists in your connected Power Automate environment, Blueprint can link it back to that environment and Find and Replace will work normally. If the Flow cannot be found in the connected environment, the error "PAD Flow cannot be found in the connected environment." will be displayed and the feature will be inaccessible.
Choosing a Scope
Before making edits, select what portion of your Flow to work with:
- Entire Flow - Work across all subflows. A dropdown will appear letting you navigate between subflows.
- Available Subflows - Choose a single subflow for your edits
Code View
After selecting a scope, you'll see a table showing every action in your selection. Each row displays the line number, action name, underlying Robinscript, and parameters. Use the checkboxes on the left to select actions for replacement.
Table Glossary
Name | Description |
Line | The line number for the action in PAD |
Action | The action name as it appears in PAD |
Robinscript | The underlying Robinscript that represents this action |
Parameters | List of all parameters for the current action |
Two Ways to Make Edits
- Find & Replace – Search for specific text in the Robinscript and replace it with different text. Useful for bulk updates like changing file paths or browser types across your Flow. Allows for regular expressions in the "Find" field
- Replace Selected Actions – Select one or more adjacent actions using the checkboxes, then replace them entirely with new Robinscript you provide. Use this when you need to rewrite actions rather than just modify text within them. (Actions must be adjacent)
Validate your Changes
Before applying edits, click Validate in the top toolbar to check your Robinscript for syntax errors. This step is recommended but optional—validation also runs automatically when you apply changes.
Reviewing and Applying Changes
As you make edits, they're added to a queue at the bottom of the screen. Changes appear in the order you made them. From here you can:
- Undo the last change – Remove the most recent edit from the queue
- Discard all changes – Clear the queue and start over
- Apply Changes – Save your edits. You'll choose one of the following:
- Overwrite Existing Flow – Update the current Flow in place (requires "Edit" permission). Recommended. This preserves your change history for tracking via the Changes feature, and doesn't consume an additional license to track in Blueprint.
- Create as New Flow – Save as a new Flow in your Power Automate environment (requires "Create" permission). This will consume an additional license to import to Analyze as it is technically a new Flow.
- Cancel
After clicking "Apply Changes"
- The resulting Flow will be saved as a Draft, regardless of whether you chose to overwrite the existing Flow or create a new one.
- Blueprint will then automatically reimport the Flow.
Current Limitations
- If your changes reference resources — such as selectors, images, or UI controls — those references are stored as GUIDs. Those GUIDs must already exist in the target flow, otherwise the Flow will break.
- The user submitting a Find and Replace job must have co-owner rights to the target Flow and all flows it depends on. If the Flow calls any child Flows the user does not co-own, the job will fail. For example: if a user has co-owner rights to Flow A but not Flow B, and Flow A calls Flow B, the job will fail.
Reviews
The Review tab enables users to collaborate and conduct manual reviews of their processes.
Review Status
Reviews can have 3 statuses
- Not Approved – Any process not in state Approved or Code Changed
- Approved – Any process that has been Approved by a user
- Code Change – If a newer version of the process is reimported, it should go through the review process again. Blueprint will automatically label newer versions of imported processes as a Code Change.
Actions
On the right side of the page, users can choose to:
- Leave a Comment
- Approve – Users can optional leave a comment on approval as well
Any action will be logged in the table on the left in chronological order.
Reviewers
Any user that Leaves a Comment or Approves is automatically added as a Reviewer. Users can also manually add other reviewers by clicking the whitespace in the Reviewers field and typing the name of a user in Blueprint.
Tests
The Tests tab allows users to create new Tests or see all existing Tests for the current process.
Table Glossary
Name | Description |
Test | Name of the Test |
Test Status (PAD Only) | Only applicable for Automated Tests. Displays whether the Test is ON or OFF |
Type | Displays the type of Test (Automated, Manual, or AI Generated Manual) |
Creation Date | Date the Test was created. Can be modified by clicking the Test value and manually adding a description. |
Description | Displays a custom description for the current Test. This must be entered manually by clicking the Test value. |
Environment (PAD Only) | Only applicable for Automated Tests. Displays the PAD environment the Automated Test runs in |
Test Runs | Number of Runs the Test has performed |
Latest Run | Status of Latest Run (Succeeded, Failed, Not Available) |
Create New Tests
- From the Tests tab, click the Create button in the top right
- Select the type of test from the dropdown
- AI Generated Manual
- Automated (PAD only)
- Manual
Create Manual Tests
- AI Generated Manual – Requires user to set up their GenAI Settings.
- Blueprint’s trained AI model will analyze the current process and generate Tests, Test Steps, and a Description for your manual test.
- Manual
- User will be prompted to provide Test Steps and a Description for their test.
Submit Manual Test Runs
- Fill out the Manual Test Run fields on the right, including:
- Start Date
- Test Result
- Add any comment or notes that should be added
- Click Submit
Create Automated Tests (PAD Only)
Requires user to set up Dataverse Synchronization and Service Account Secret. See Settings and Configuration - Power Automate Desktop
- In the set up wizard, user will need to:
- Select Connection
- Select Mode
- In the Automated Test Details page, user will need to:
- Set a schedule for the Test to run
- Create Test Cases - Users can select any PAD action within the Flow and configure any number of asserts that must be met during runtime. If any assert is not met, the test will fail.
- When finished setting up the Automated Test, click "Publish" in the top right
Test Runs
The Test Runs tab displays data on the Runs associated with the given process, provided there is an associated Test.
Test Coverage (PAD Only)
This is the percentage of total actions that have been executed in at least 1 Automated Test Run. Total Coverage only accounts for Test Runs since the most recent modification date. If a newer version of the Flow has been imported, Test Coverage resets to 0%.
Table Glossary
Name | Description |
Result | Result of the test (Succeeded, Failed) |
Case (PAD Only) | Only applicable for Automated Tests. If Failed, displays the specific Test Case that failed |
Test | Name of the Test |
Type | Displays the type of Test (Automated, Manual, or AI Generated Manual) |
Start | Start datetime of the Run |
PAD Last Modified Date (PAD Only) | Last modified Date of the PAD Flow |
Owner (PAD Only) | Owner of the PAD Flow |
Coverage (PAD Only) | Only applicable for Automated Tests. Percentage that displays the total actions in the Flow that were executed in the Test Run |
Environment (PAD Only) | Only applicable for Automated Tests. Displays the PAD Environment the Automated Test runs in |
Log (PAD Only) | Only applicable for Automated Tests. Click to see a sequential list of all actions that executed in the current Run. Also displays if the action has an associated Assert, and if the Assert Succeeded or Failed |
Successful Asserts (PAD Only) | Only applicable for Automated Tests. Displays the total number of Successful Asserts for the given Run |
Failed Asserts (PAD Only) | Only applicable for Automated Tests. Displays the total number of Failed Asserts for the given Run |
Not Executed Asserts (PAD Only) | Only applicable for Automated Tests. Displays the total number of Asserts that did not execute for the given Run |
Flow Activity (Analyze - PAD only)
The Flow Activity tab displays operational data on current PAD Flow, provided it has run in the connected Environment. For more information, see this article.
Card Glossary
Name | Description |
Total Runs | Total Runs of all Flows |
Total Successful Runs | Number of Successful Runs |
Total Failed Runs | Number of Failed Runs |
Error Rate | The number of Failed Runs divided by Total Runs for the Period |
Chart Glossary
Certain metrics are considered anomalous if they are +/- 3 standard deviations away from the mean. Metrics with Anomaly tracking will have a legend indicating Average and ± std.dev*3
Name | Description |
Run History | Displays all Runs of the Flow in the selected timeframe |
Total 5 Errors | Displays the top 5 most common errors. User can hover to see more details. |
Queued Flows Duration | Displays queue time for all Flows in the selected timeframe |
Execution Duration | Displays Execution Duration for all Flows in the selected timeframe |
CPU | Displays CPU usage for all Flows in the selected timeframe |
Memory | Displays Memory usage for all Flows in the selected timeframe |
Table Glossary
Name | Description |
Anomaly | For a given Flow, certain metrics are considered anomalous if they are +/- 3 standard deviations away from the mean. If a run has 1 or more anomalous behavior found, this flag appears. |
Flow | Name of the Flow |
Start | Datetime the run started |
Status | Status of the run (Succeeded, Failed) |
Duration | Sum of Queue Time + Execution Time |
Queued Duration | Time the Flow spent in status Queued |
Execution Duration | Total time for the Flow to execute |
CPU | CPU usage |
Memory | Memory Usage |
Error List | If Failed, displays the error message |
Machine | Machine that ran the Flow |
Last Modified | Last Modified Date of the Flow |
Mode | Mode of the Flow Run (Attended, Unattended, Local |
Changes (Analyze - PAD only)
The Changes tab offers advanced version control for PAD, including:
- Automatic change tracking and history
- Ability to restore any previous version
- Visual comparison between versions
- User attribution for all changes
- Timestamped version history
Versioning Types
Blueprint supports two versioning types, configurable in Blueprint Settings: Blueprint Versioning and Microsoft Versioning. The type you choose determines how and when Flow versions are captured and stored. For more information see Analyze Settings
When navigating to the Changes tab, users will see historical versions of PAD Flow. What appears in this history depends on your versioning type.
Blueprint Versioning
A new Flow-version is recorded each time the Flow is imported into Blueprint — either manually by a user or automatically after 24 hours if the Flow has been modified. Blueprint does not mirror every version saved in PAD.
- For example, if a user imports a Flow and then saves 5 new versions in PAD, only one new Flow-version will appear in Changes at the next import.
Table Glossary
Name | Description |
PAD Modified Date | Date-time that the Flow-version was modified by developer in Power Platform |
PAD Modified By | Name of developer who modified the Flow-version in Power Platform |
Imported Date | Date-time that the Flow-version was imported to Blueprint Assess |
Imported User | User who imported the Flow-version into Blueprint Assess. Note: will be “Blueprint System” for automatically retrieved versions (maximum one per day). |
Actions | How many actions are in the Flow-version. |
Comment | An editable field for user comments |
Microsoft Versioning
Blueprint fetches every version that exists for the flow in Power Platform. All versions are retrieved upon page refresh.
Table Glossary
Name | Description |
PAD Modified Date | Date-time that the Flow-version was modified by developer in Power Platform |
PAD Modified By | Name of developer who modified the Flow-version in Power Platform |
Version Type | Displays the Version Type of each Save
Note - If a row does not save "Published", then it was saved as a "Draft" in PAD |
Actions | How many actions are in the Flow-version. Click the icon in the cell for Blueprint to fetch the action count |
Comment | An editable field for user comments |
Renamed Subflow Similarity Level
When a renamed Subflow also has its contents change, it is subjective when you’d call it a new Subflow vs. a renamed Subflow. If you change the name and one character within it, you would consider it the same Subflow just with a different name (renamed). However if you change its name and completely re-write the contents, you would consider it an entirely different Flow. Blueprint Assess lets you adjust the level at which you’d consider it a renamed vs. new Subflow with this percentage field. The default is set to 75%.
Comparing Flow-Versions
- Select any two (2) Flow-versions. The Compare button will become available only when two Flow-versions are selected.
- Click the Compare button to see the list of Subflows and their change status. There will be two tabs available at the top called Subflows and Variables
Subflows
Displays a table with all subflows between the two selected versions
Table Glossary
Name | Description |
Subflow | Name of the subflow |
Change | Displays the type of change:
|
Type | Whether the PAD subflow is Global or Local |
Click a changed Subflow to see detailed changes
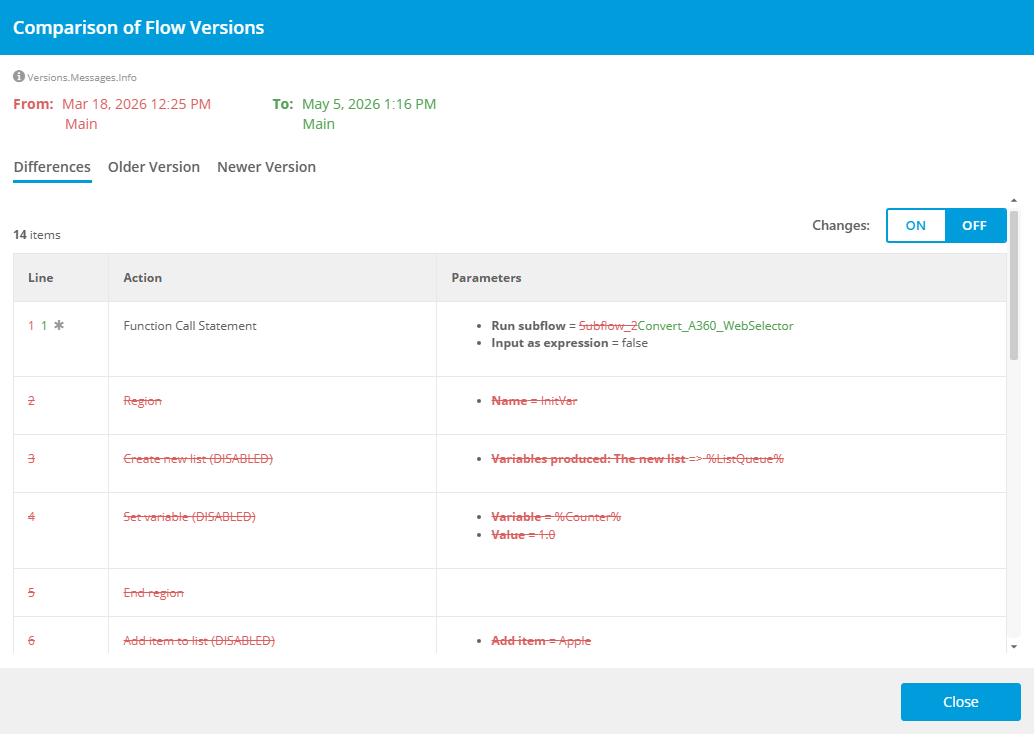
- Differences Tab: Shows precise changes using red-strike font for deletions and green font for additions
- Older Version Tab: Shows actions of the original/older Flow-version
- Newer Version Tab: Show actions of the newer Flow-version
- Changes toggle: When enabled, hides unchanged lines so only rows with differences in the Action or Parameters columns are visible.
For example, an “Unchanged” Subflow will only have a single tab (Newer Version) since there are no differences.
Variables
Display all Input, Output, Local, and Flow variables that have changed between the selected versions
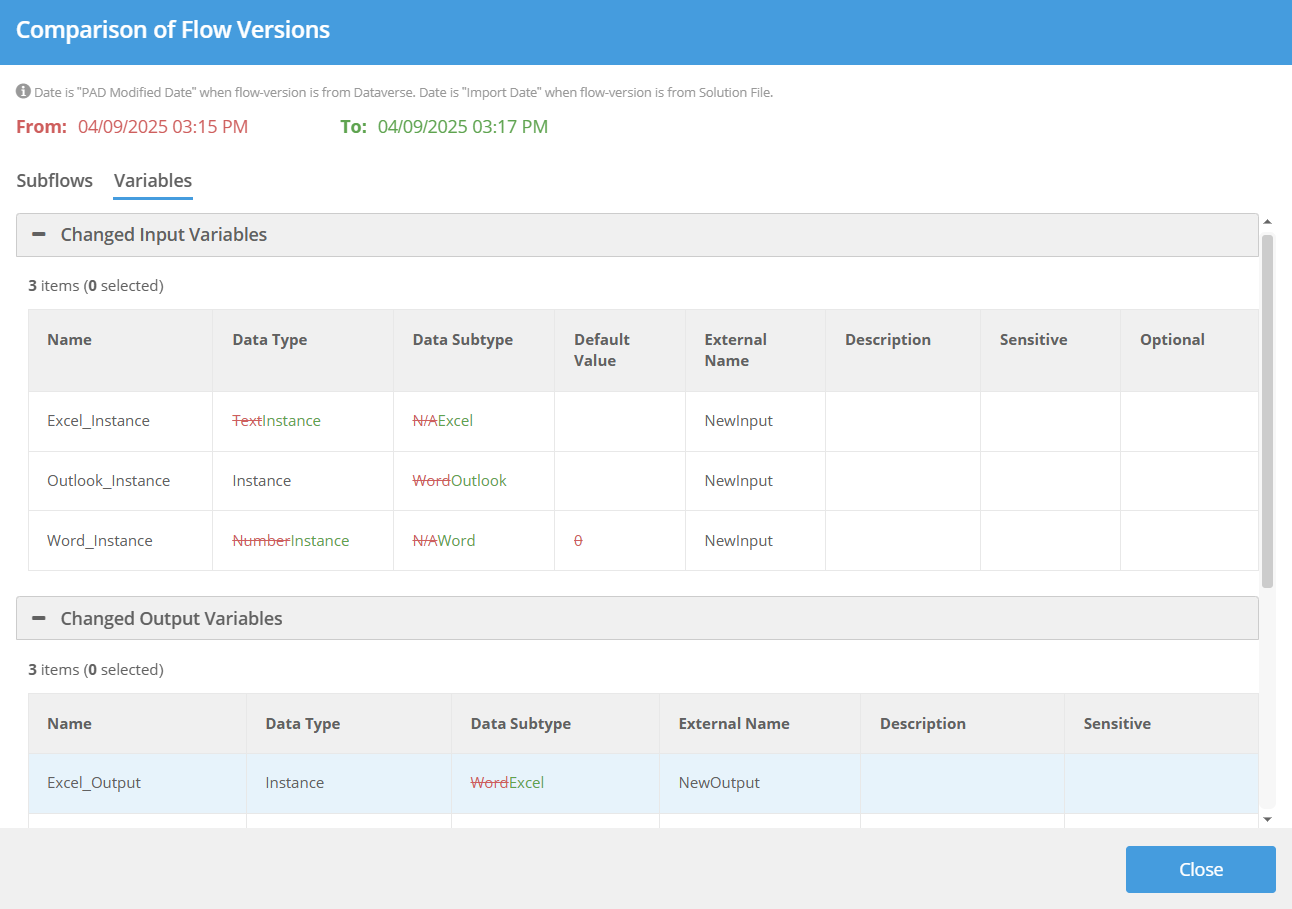
- Shows precise changes using red-strike font for deletions and green font for additions
Flow Restore
Users can restore previous versions of Flows saved in Assess by following these steps:
- Select the specific Flow version you want to restore by checking the checkbox in the leftmost column
- Click the "Restore" button
- Confirm your selection in the popup dialog that appears
Upon confirmation, Blueprint will create a copy of the selected Flow version in your linked Power Automate Desktop environment, matching the exact state of the Flow at the time it was saved.
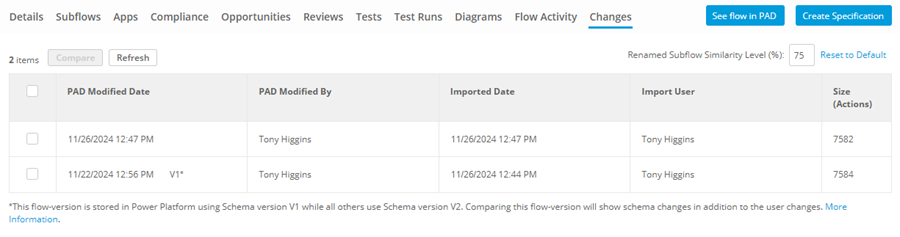
Schema V1 Flow-Versions
Sometimes a Flow-version has a “V1*” appended to its name (see below). This denotes that the flow has been stored in Power Platform using Dataverse schema v1, whereas all other Flow-versions are stored using Dataverse schema v2.
When Blueprint Migrate creates PAD Flows, they are stored in schema v1. The first time a developer edits the Flow, it is then saved in schema v2 going forward. Therefore, only the first/oldest Flow-version should ever have this annotation.
When a user chooses to compare a schema v2 Flow-version with a schema v1 Flow-version, they will not only see changes that were made by a developer, but will also see the schema differences which may be confusing. For this reason, Blueprint highlights schema v1 Flow-versions and provides a note explaining this for the user.
Logs
The Logs tab provides a streamlined log experience perfectly suited to developers who use a "trace log" when developing. This replaces the need for create a "log" text file and writing messages to that file throughout the Flow to trace it's execution during development, which developers often do. The PAD run log is cumbersome to use for this purpose.
This feature can be enabled/disabled in Settings > RPA Management > Analyze > Power Automate Desktop > Enable PAD Log. The feature also depends upon the Dataverse Syncrhonization to be setup, which is just below the above enable setting.
The table shows messages written using the PAD "Log Message" action from a Flow's run. The run is identified from it's date/time and the Log Message action is identified from Subflow and action index. If the message string in the Log Message action was from a variable, the name of that variable is provided in the last column. The log level is one of Info, Warning, or Error as specified in the Log Message Action.
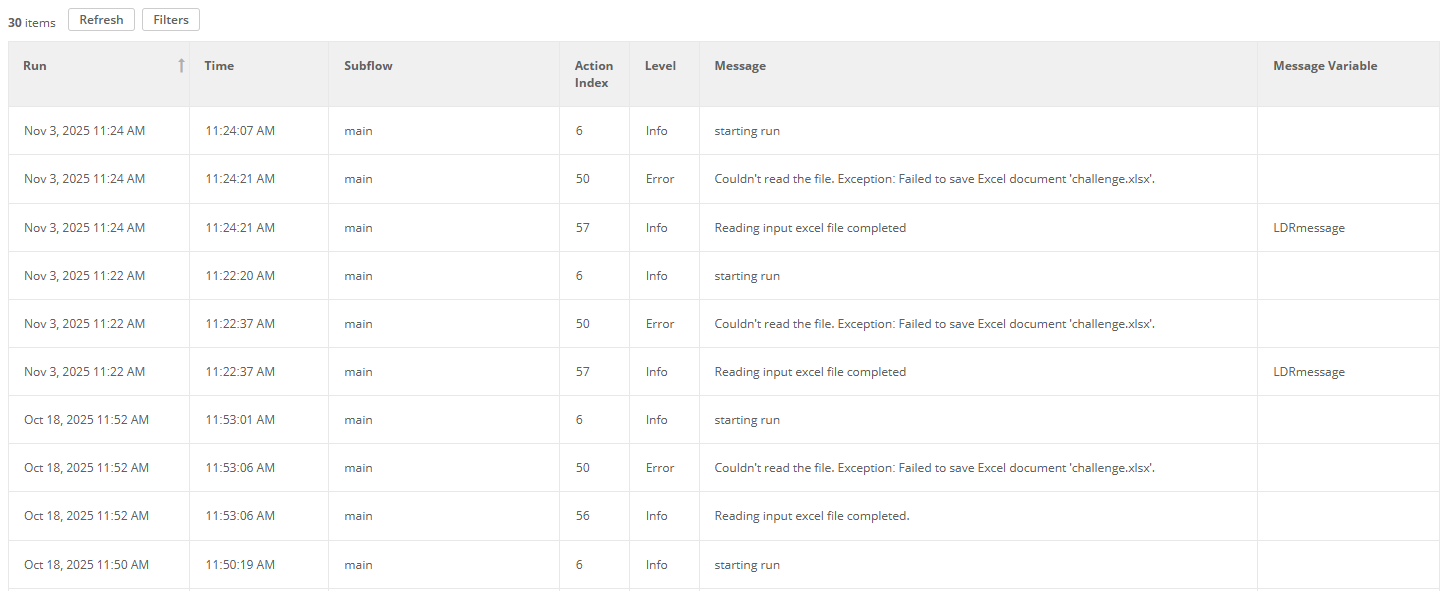
The table filter allows for filtering across any combination of the columns.
Agent Descriptions
The Agent Description tab streamlines the configuration process for invoking RPA processes from AI Agents by automatically generating all of the necessary information an AI Agent needs to call an RPA process.
To do so, simply click the Generate with AI button at the bottom of either the Copilot or Salesforce sections. The generated text can be edited if needed.
If want to disable one or both options, go to Settings > RPA Management > Gen AI > Agentic Agents and deactivate the relevant options.
How did we do?
Features