Applications Dashboard
The Applications Dashboard provides information about applications used by processes within a selected Scope (Project or Folder). Accessing the Applications Dashboard. Choose RPA Dashboards and Repor…

Updated
by Tony Higgins
The Applications Dashboard provides information about applications used by processes within a selected Scope (Project or Folder).
Accessing the Applications Dashboard
- Choose RPA Dashboards and Reports in the main header.
- Select Applications.
- Select Per Process View or Per Call Tree View from the Views dropdown.
Per Process View will only contain the items within the Project, Folder, or Process selected.
Per Call Tree View will search for dependencies of each Main or Root process and add them to the current scope, even if they weren't in the initial folder or process selected.
Per Call Tree View will search for dependencies of each Main or Root process and add them to the current scope, even if they weren't in the initial folder or process selected.
- Select the desired scope on the top right by clicking Change Scope and click on OK. For more information, see Selecting a Scope and View.
Using the Applications Dashboard
- Features available on the Applications Dashboard include:
- Refresh: The Refresh button will refresh the contents of the dashboard with the latest data in the chosen scope.
- Processes By Application charts: This doughnut chart shows how many processes in the selected scope are using each application.
- Steps By Application charts: This doughnut chart shows how many steps in the selected scope are using each application.Note: Hovering the cursor on any segment in the charts will show you the number for that particular type of application.
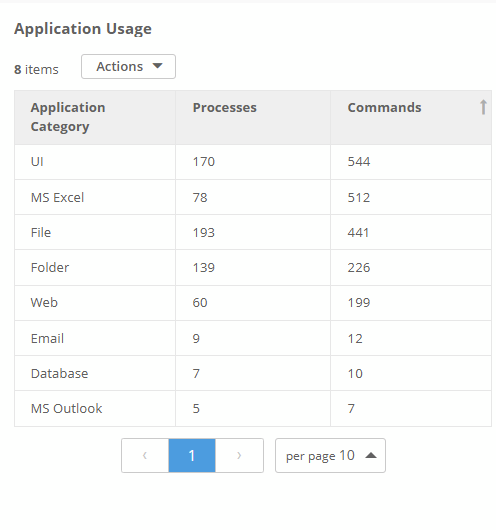
- Application Usage: Displays how many processes and steps are using each application. Click on a column header to sort the table by that column, or use the search bar to find a specific application.
- The table can be exported by clicking the Actions dropdown and then Export to Excel.
- The table can be exported by clicking the Actions dropdown and then Export to Excel.
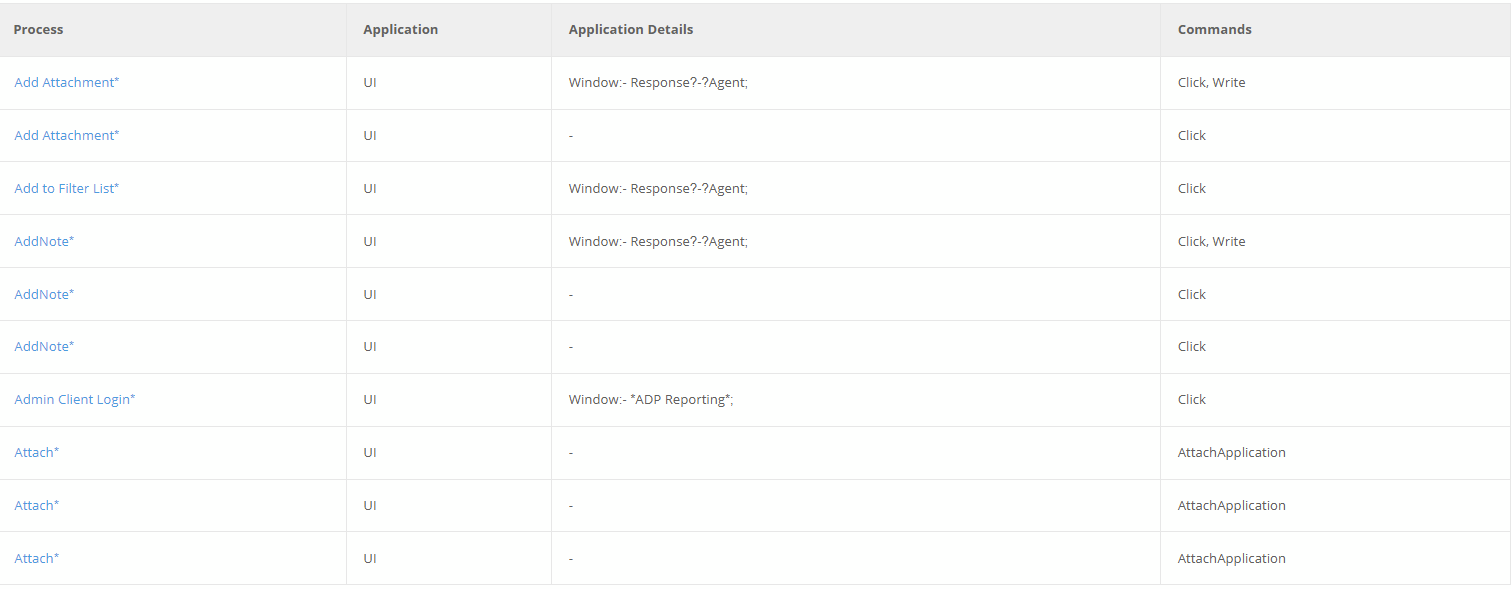
- Processes Using Application: The Processes Using Application Table summarizes which processes are using which applications, as well as a list of commands interacting with said application. The Application Details Column provides specific information regarding the application type. For Instance, in the case of an application categorized as UI, this column exhibits the application's name( Window Name) with which the process engages. When dealing with Web applications, the Application Details displays browsers information like Chrome, IE, or Firefox and along with the application's name (Window Name) with which a process interacts with. The table can be filtered on specific applications by typing them in the search bar at top-right. Added a hyper link to the process name which will navigate the users to the process.
- The table can be exported by clicking the Actions dropdown and then Export to Excel.
 Blueprint will not show statistics for any processes deemed duplicates. When importing RPA data, Blueprint detects if the identical component had been imported before. It will be flagged as a 'duplicate', separated out on the Statistics Dashboard and will not consume additional licenses if/when activated.
How did we do?
Statistics Reports
Applications Report