Table of Contents
- Overview
- Nomenclature
- Importing Automations from an RPA Platform
- Selecting Scope for Dashboards and Reports
- Questions You Can Answer using Dashboards and Reports
- How large are my automations?
- How complex are my automations?
- How can I quickly see the worst case automations for size and complexity?
- Where can I find information on how my automation is constructed?
- Where can I find even more details on how my automation is constructed?
- What are all the processes that comprise my automation?
- What applications are my processes using, and how much?
- Is anything called that wasn't included in the import?
- Which components are currently being reused in my estate?
- What opportunities are their for additional reuse? (i.e. do I have duplicate/redundant information?)
RPA Value-Mapping Assessments
Overview. Blueprint is able to import existing automations and even entire automation estates from RPA platforms and present valuable details and insights via dashboards and reports. It is common for…

- Overview
- Nomenclature
- Importing Automations from an RPA Platform
- Selecting Scope for Dashboards and Reports
- Questions You Can Answer using Dashboards and Reports
- How large are my automations?
- How complex are my automations?
- How can I quickly see the worst case automations for size and complexity?
- Where can I find information on how my automation is constructed?
- Where can I find even more details on how my automation is constructed?
- What are all the processes that comprise my automation?
- What applications are my processes using, and how much?
- Is anything called that wasn't included in the import?
- Which components are currently being reused in my estate?
- What opportunities are their for additional reuse? (i.e. do I have duplicate/redundant information?)
Overview
Blueprint is able to import existing automations and even entire automation estates from RPA platforms and present valuable details and insights via dashboards and reports. It is common for organizations to lose sight of their automation estate over time, especially in cases of federated or distributed automation development and ownership. In addition to providing detailed visibility into the estate, this information can be used to reduce redundancies, improve quality, increase value, or as the basis for transformation or migration planning.
Nomenclature
Note is that every RPA platform has their own structures, approaches, and even vocabularies. Once imported however, Blueprint treats them all the same no matter which platform they came from. This means you may need to 'translate' what your RPA platform calls things to what Blueprint calls things. Below is a summary of this:
Blueprint Term | Automation Anywhere Term | Blue Prism Term | UiPath Term |
Process (Digital Blueprint a Process that has been 'activated', enabling more features. A Digital Blueprint is abbreviated as DGB) | Taskbot or .atmx file. Metabot logic. | Process Page or Object Action. | .xaml file |
Action | Blanket term for Commands, Variables, Decision Branches, Includes | ||
Command | Steps that are not variable declarations, decision branches, or includes | Action | Activity |
Variable | Steps that are variable declarations | Data | Variable |
Include | RunTask, RunLogic | ||
Decision Branches |
This article will use Blueprint nomenclature unless otherwise stated.
Importing Automations from an RPA Platform
The first thing you need to do is to import automations and operational data from RPA Platforms. This import could be via file (exported form the RPA platform) or API, depending on the platform. See RPA Import to Blueprint for details on how to import. After you've imported RPA content, you can then use the Dashboards and Reports to analyze and answer questions about the content.
Selecting Scope for Dashboards and Reports
For most dashboards you can select the scope for the information presented which could be the entire project, a folder in the project, or a single Digital Blueprint if desired. Selecting a folder will show information for all Digital Blueprints within that folder, and selecting a project will show results for all Digital Blueprints in the project. See How to Use the Statistics Dashboard for details on choosing the scope.
Questions You Can Answer using Dashboards and Reports
How large are my automations?
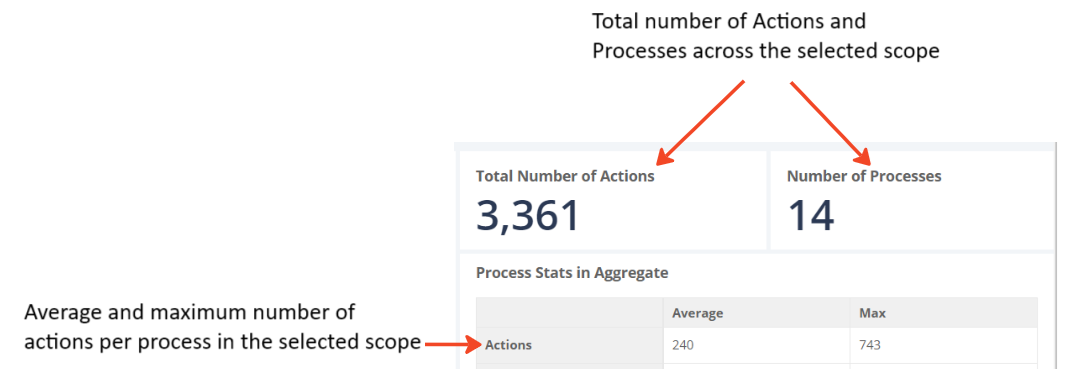
You can see the overall number of processes and overall number of actions for your entire estate at a glance, as well as the average number of actions per process, and the largest process in terms of number of actions. All of this is available at the top-right of the Statistics Dashboard.
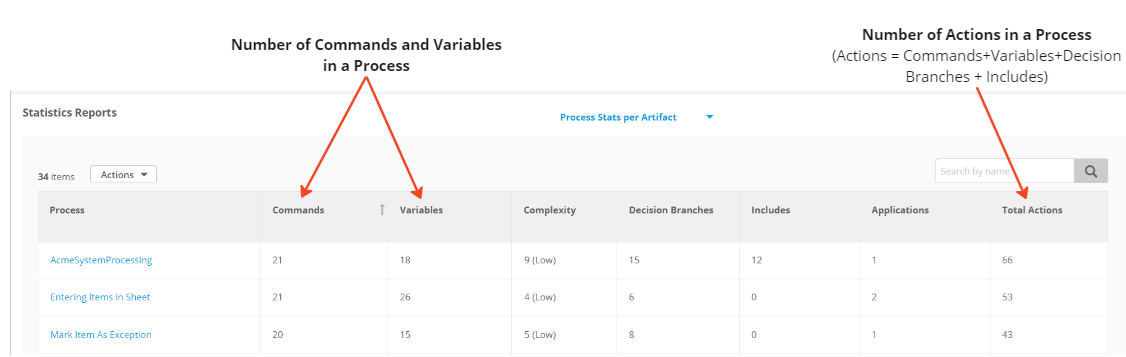
You can also see the Number of Actions within each individual process, and how many of those Actions are Commands and how many are Variables. All of these aspects can be sorted to easily find processes with the most actions, commands, or variables for example. This information is found in the table at the bottom of the Statistics Dashboard.
How complex are my automations?
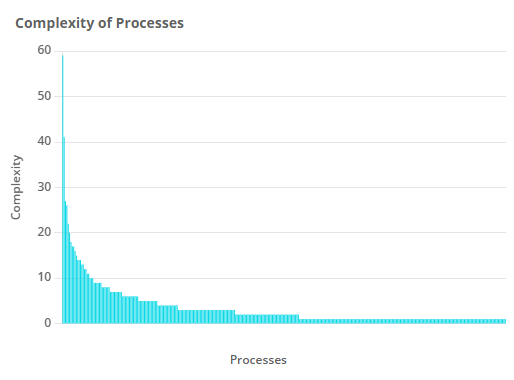
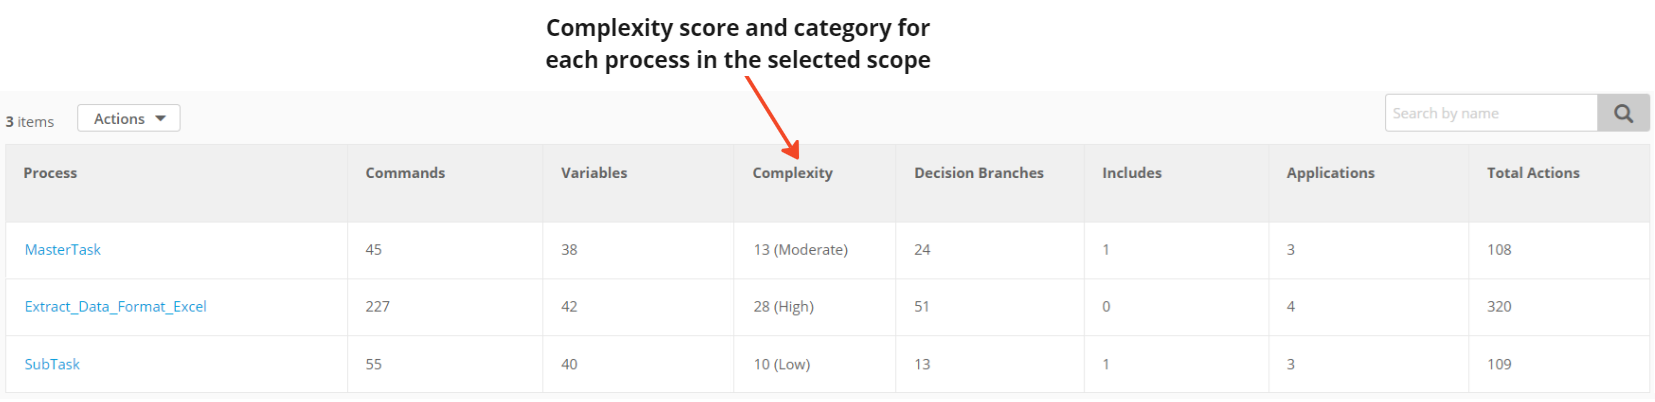
Blueprint calculates the complexity of each individual process to get a complexity score, then categorizes as High, Moderate, or Low. This information is available for each process is the table at the bottom of the Statistics Dashboard, and graphically in a histogram of all processes at top-left of the Statistics Dashboard.
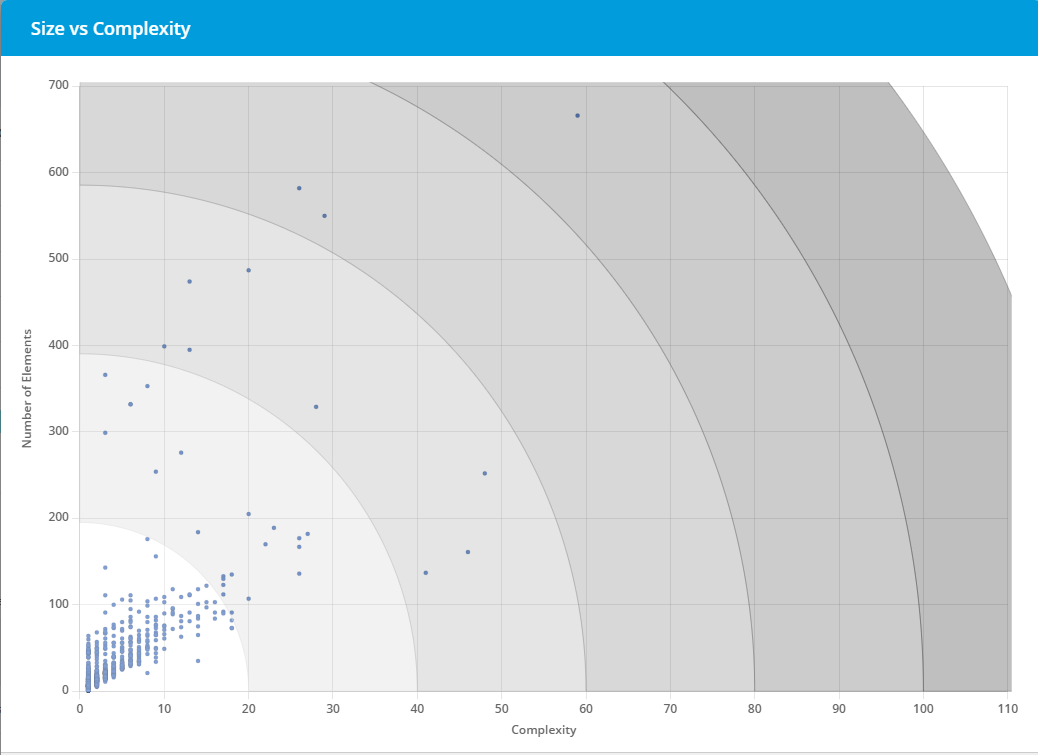
How can I quickly see the worst case automations for size and complexity?
A graphic of size vs. complexity is provided at the top-center of the Statistics Dashboard with a dot representing each process in the selected scope. Hovering over any dot gives the name of the process. The entire graph can be expanded to provide greater precision simply by clicking on it.
Where can I find information on how my automation is constructed?
Information for each process including commands, variables, mapping percentage to Blueprint's Common Object Model (COM), and to other RPA platforms, complexity, decisions, includes, applications, and total actions is provided in the table at the bottom of the Statistics Dashboard. You can search to find any of your processes within the selected scope, and can sort any of the detailed information columns.
Where can I find even more details on how my automation is constructed?
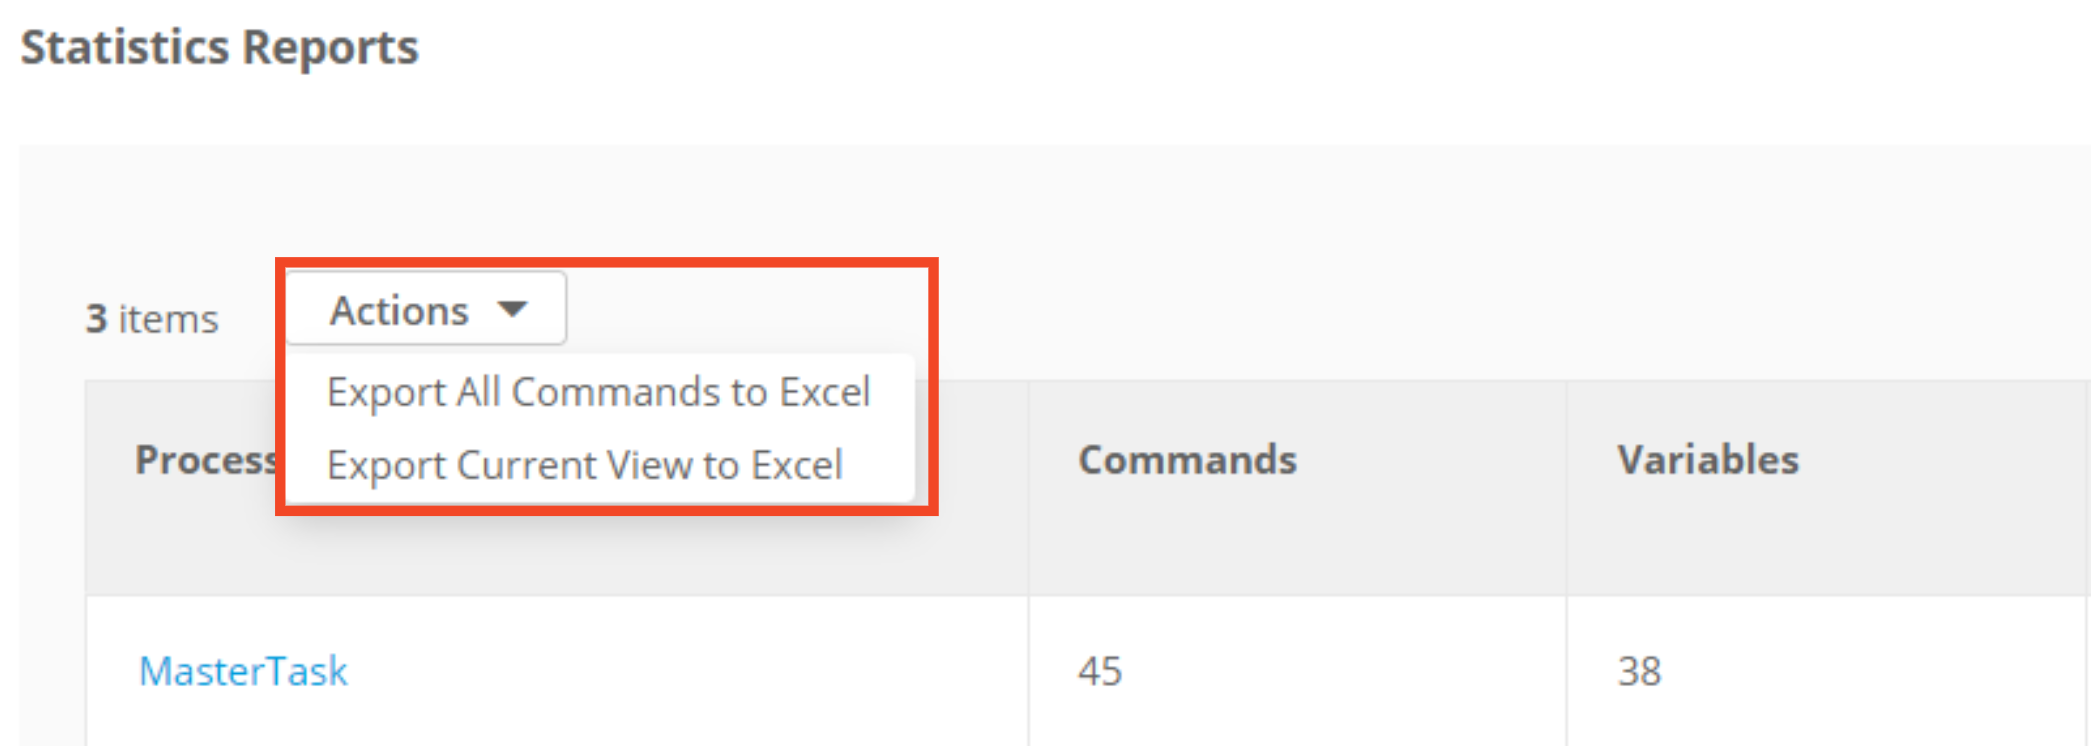
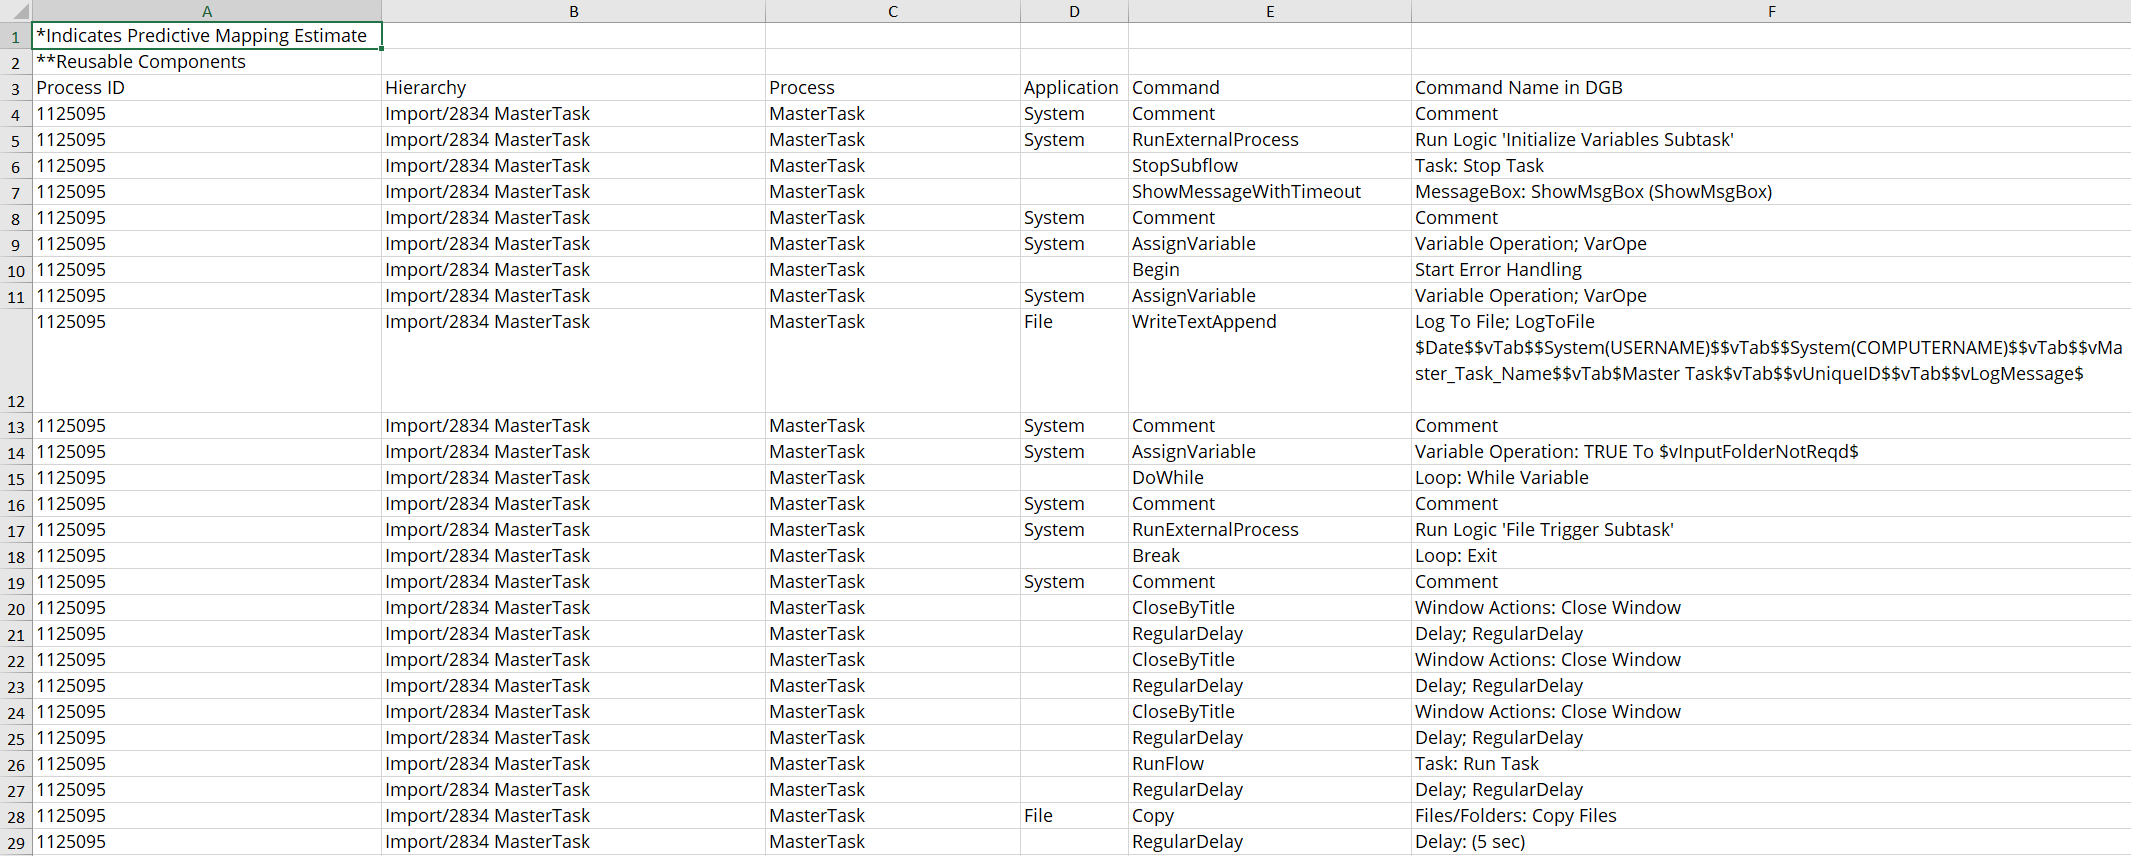
All of the commands that comprise each process is available in an exported report. To get the report, select "Export All Commands to Excel" in the Actions dropdown for the table at bottom of the Statistics Dashboard.
What are all the processes that comprise my automation?
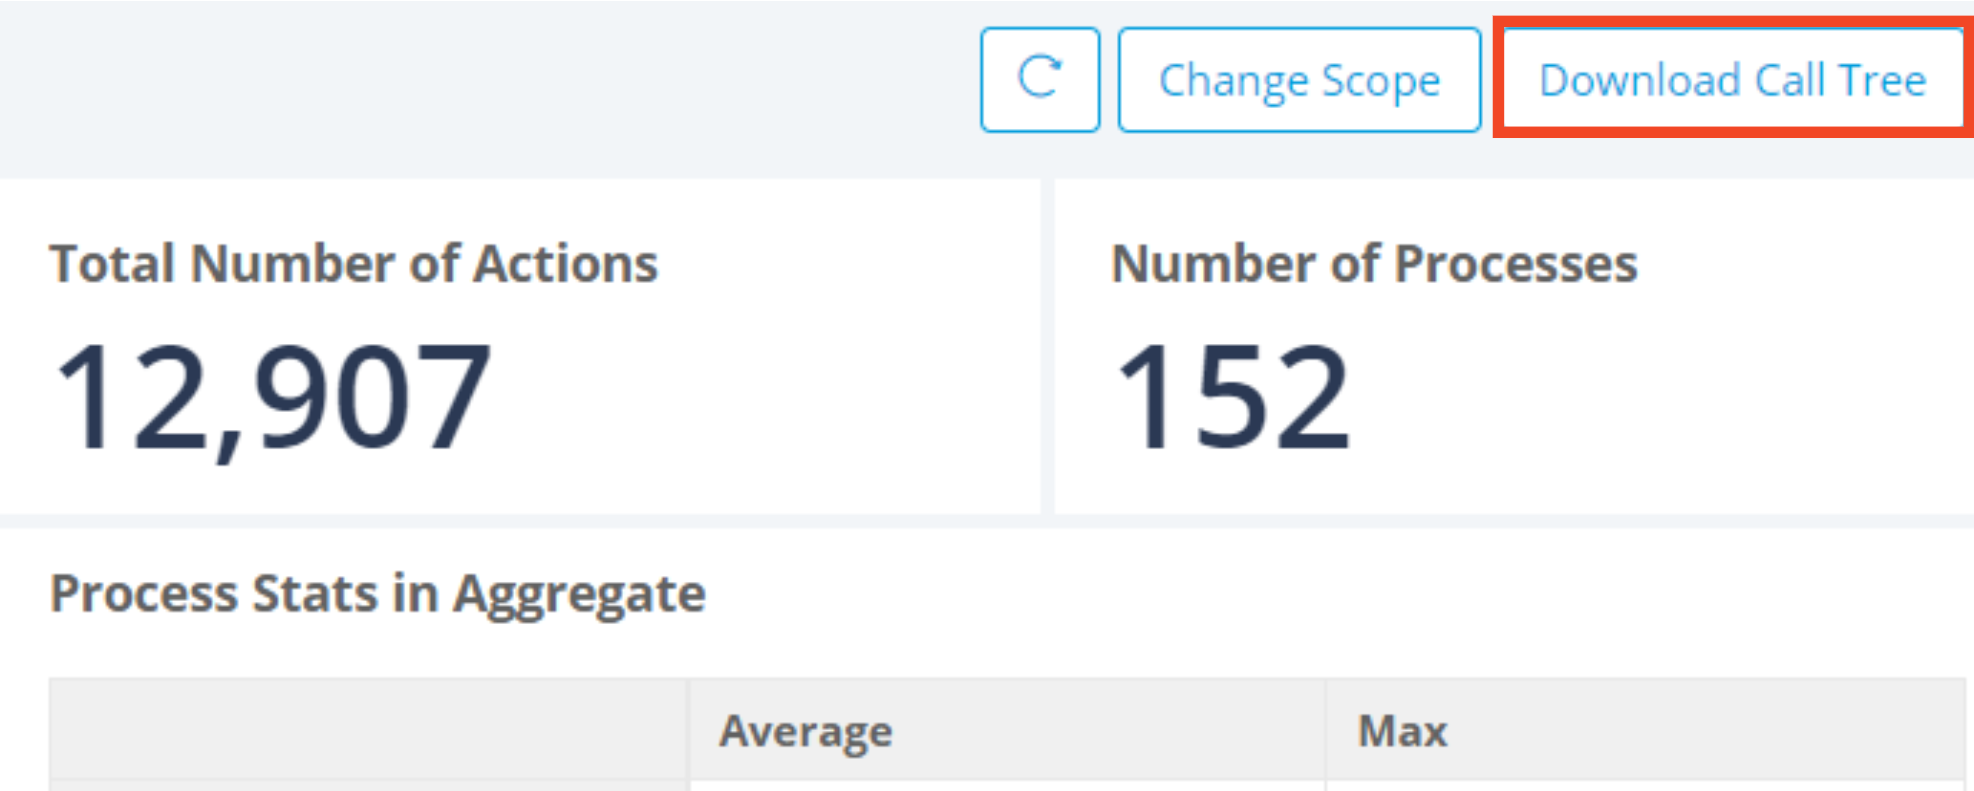
Automations are typically comprised of a main process that calls other processes, that in turn call others, to form a tree-like structure. You can generate that call tree for a selected scope by clicking the "Download Call Tree" button in the Statistics Dashboard.
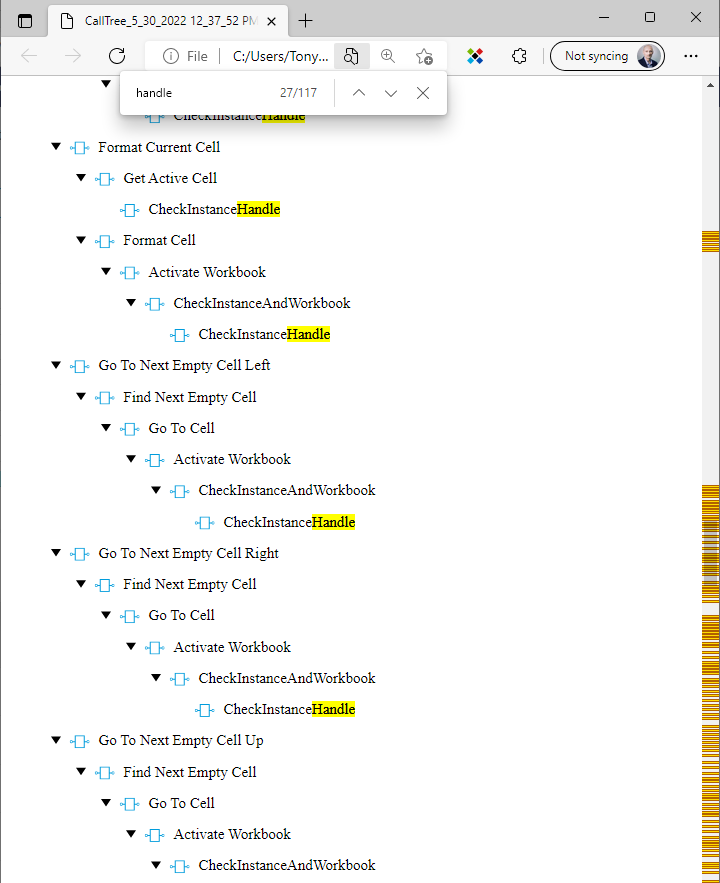
The resulting file is in SVG format that can be opened in any internet browser. Since the contents can be very large, this format allows it to be zoomed to any extent and still be readable. It is also searchable using the browser's search (CTL-F), an example shown in the diagram above.
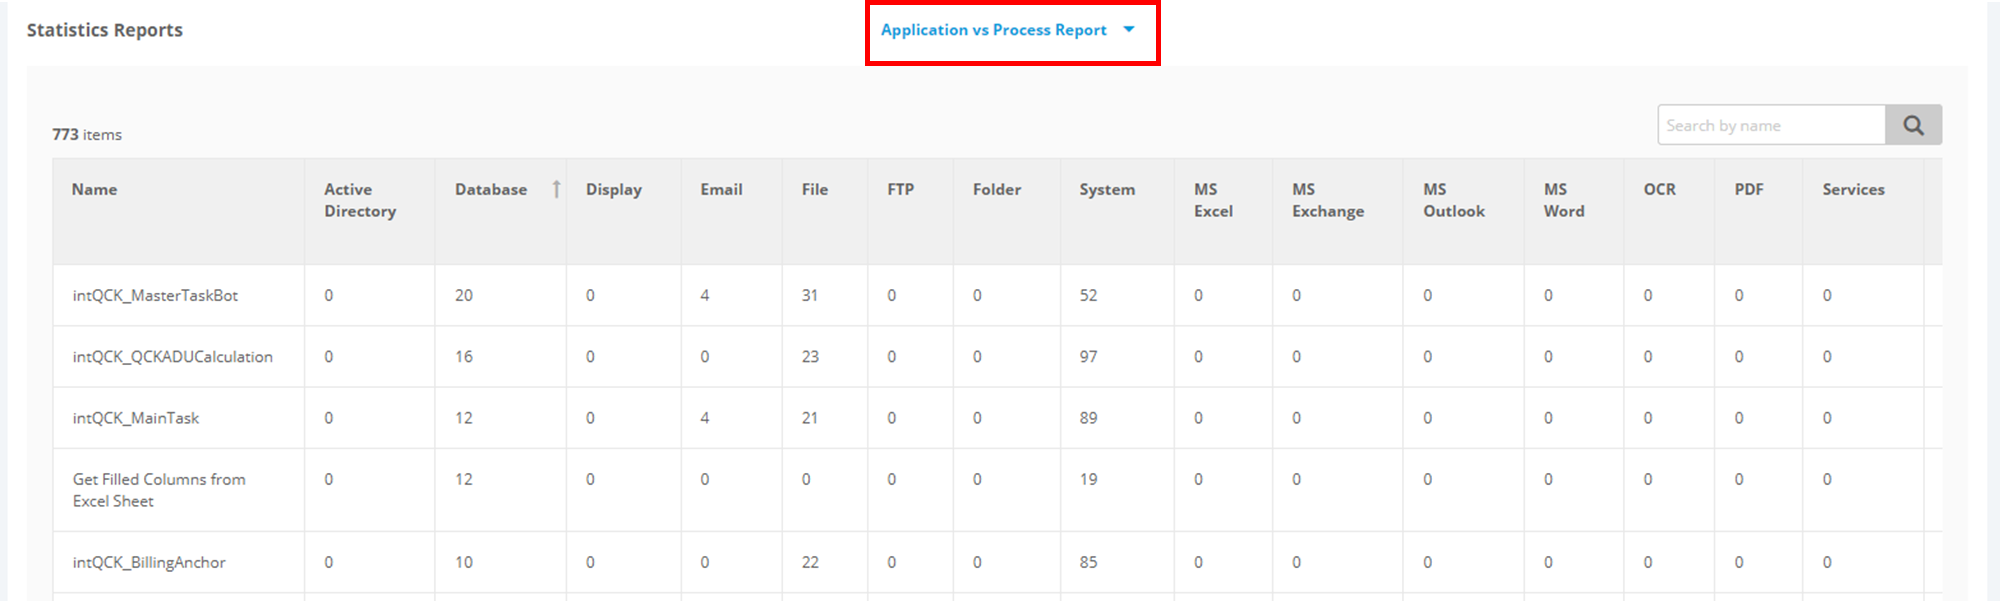
What applications are my processes using, and how much?
Automations interact with applications and its often required to know how many applications, which applications, and how often these interactions occur. You can see an on-screen report that shows this information for each process within the selected scope. This is found in a table at the bottom of the Statistics Dashboard after choosing "Application vs. Process Report" in the table selection drop-down (see below).
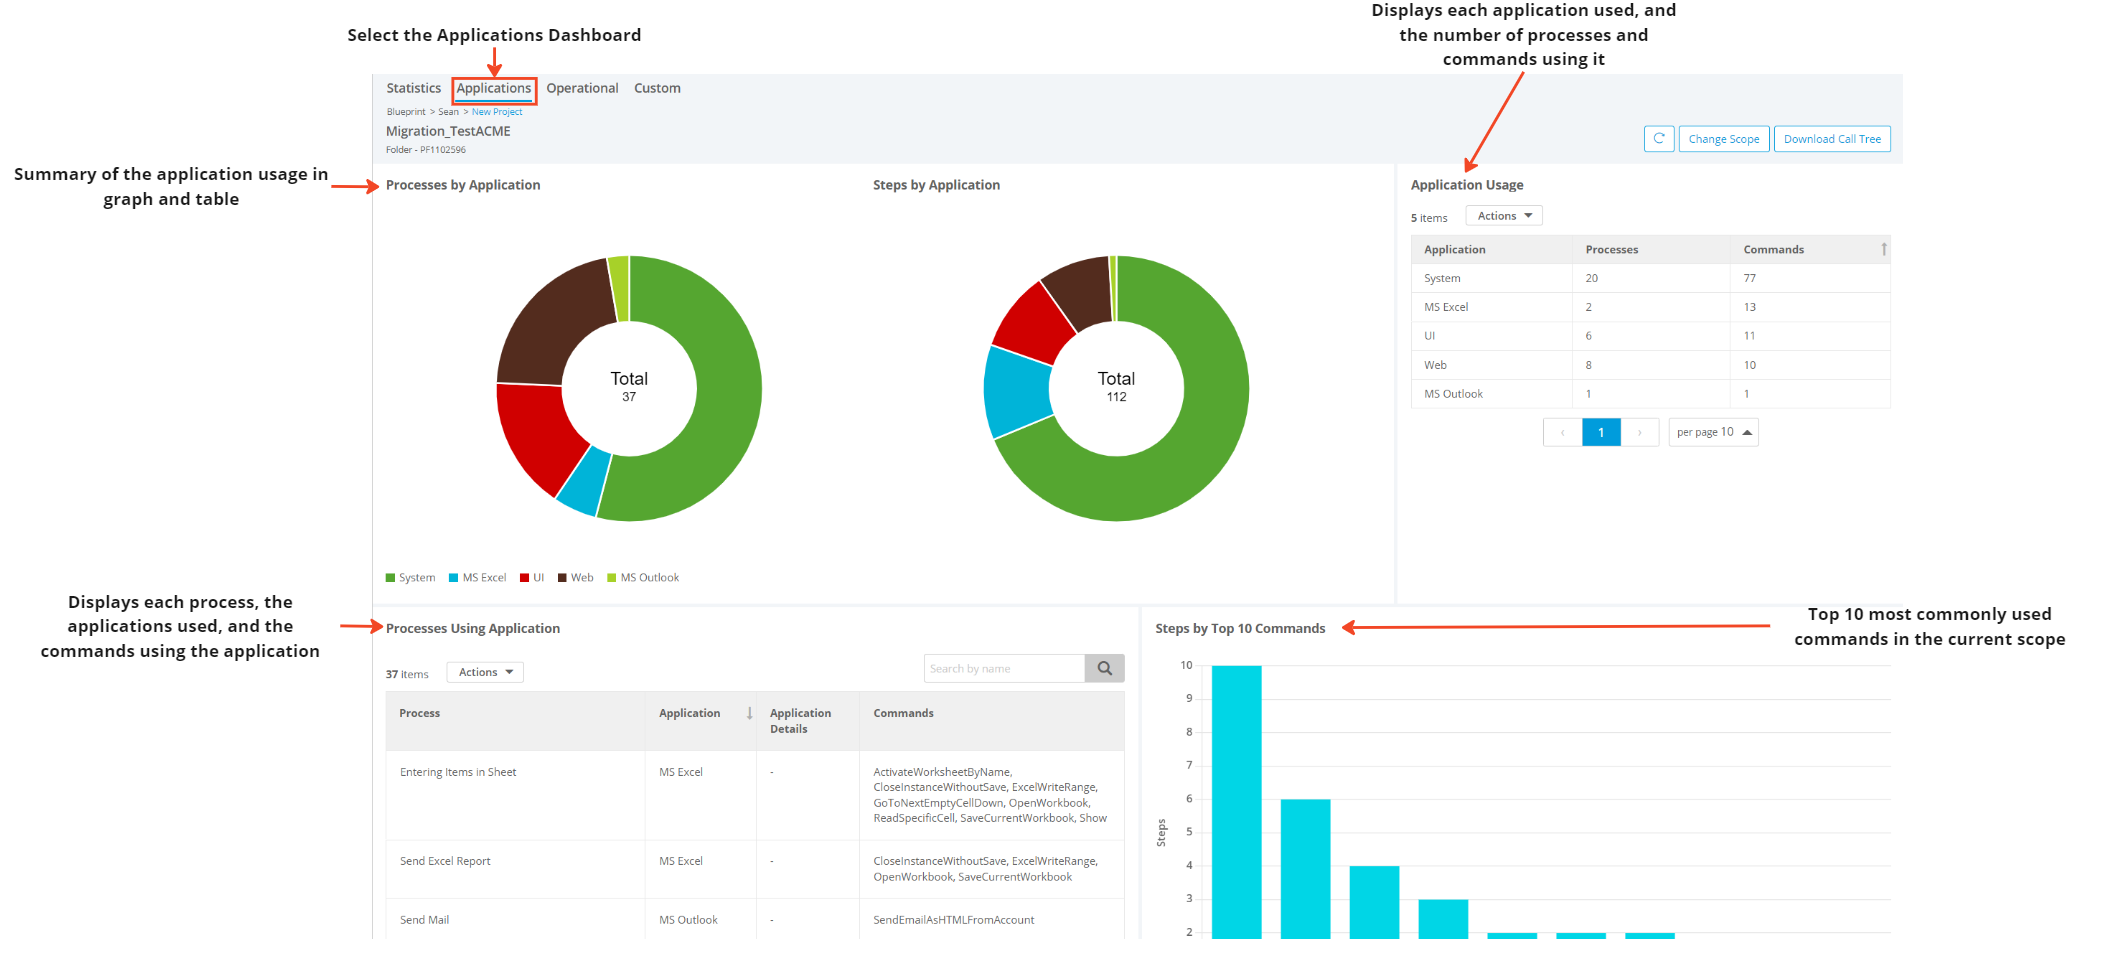
Additional summary information about process and application interaction can be found on the Applications Dashboard. On the left side of this dashboard is summary information about how often particular applications are referenced. On the right side is the ability to select an application and see the specific processes that reference it, or the opposite: select a process and the applications it references.
Is anything called that wasn't included in the import?
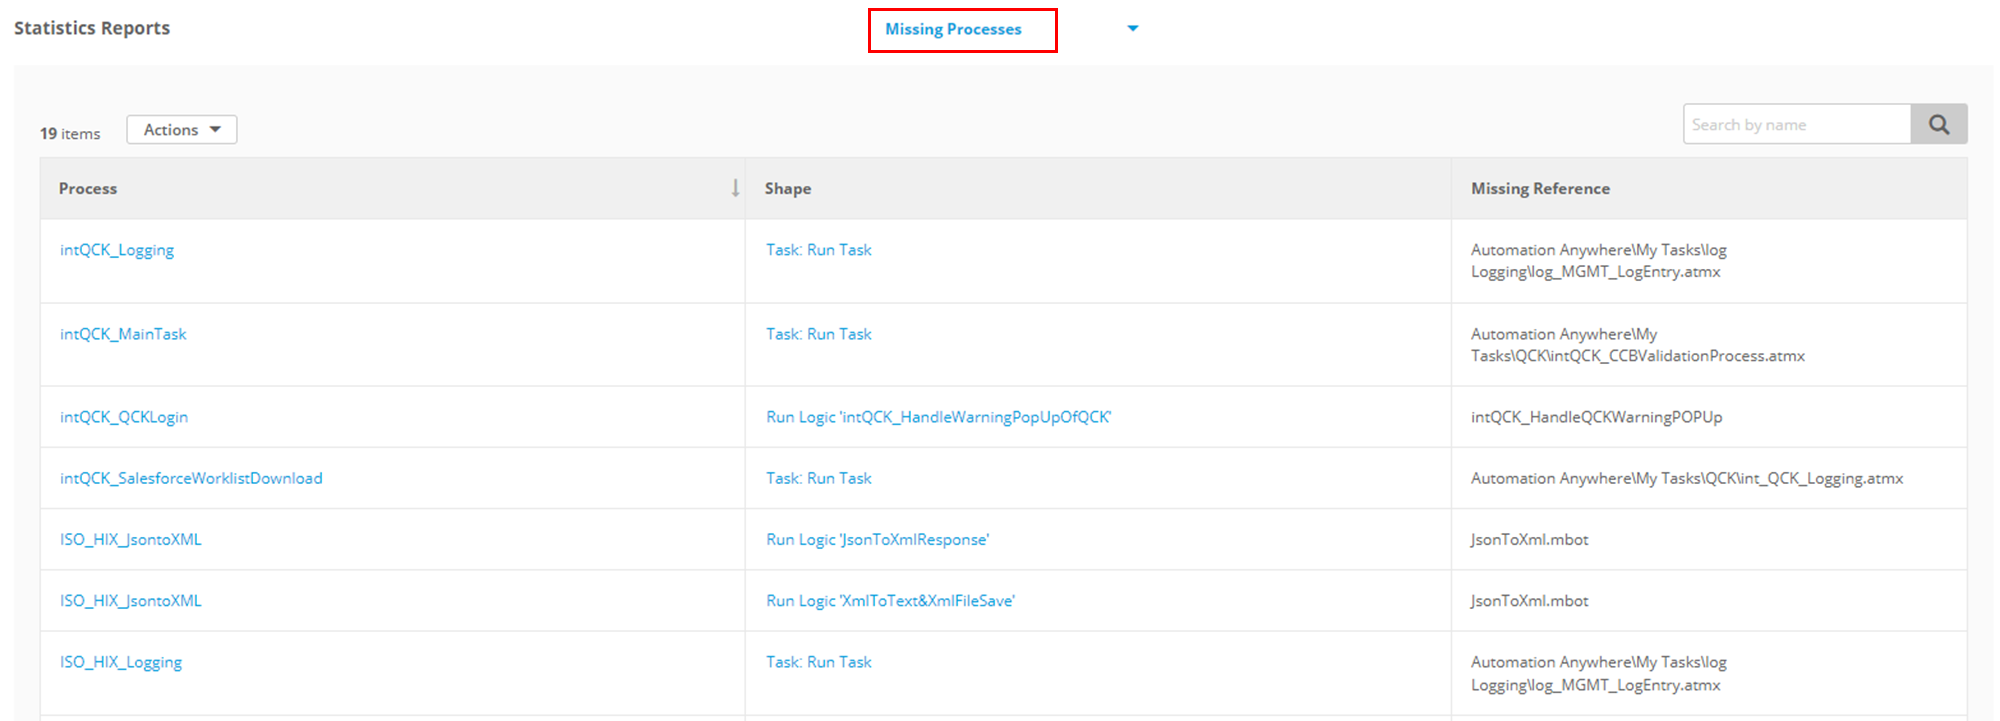
It's important to know if you have the required components when analyzing an estate for migration, or if anything is missing. Blueprint provides a "Missing Processes" report that lists any components being called that don't currently exist in Blueprint. This is found in a table at the bottom of the Statistics Dashboard after choosing "Missing Processes" in the table selection drop-down (see below).
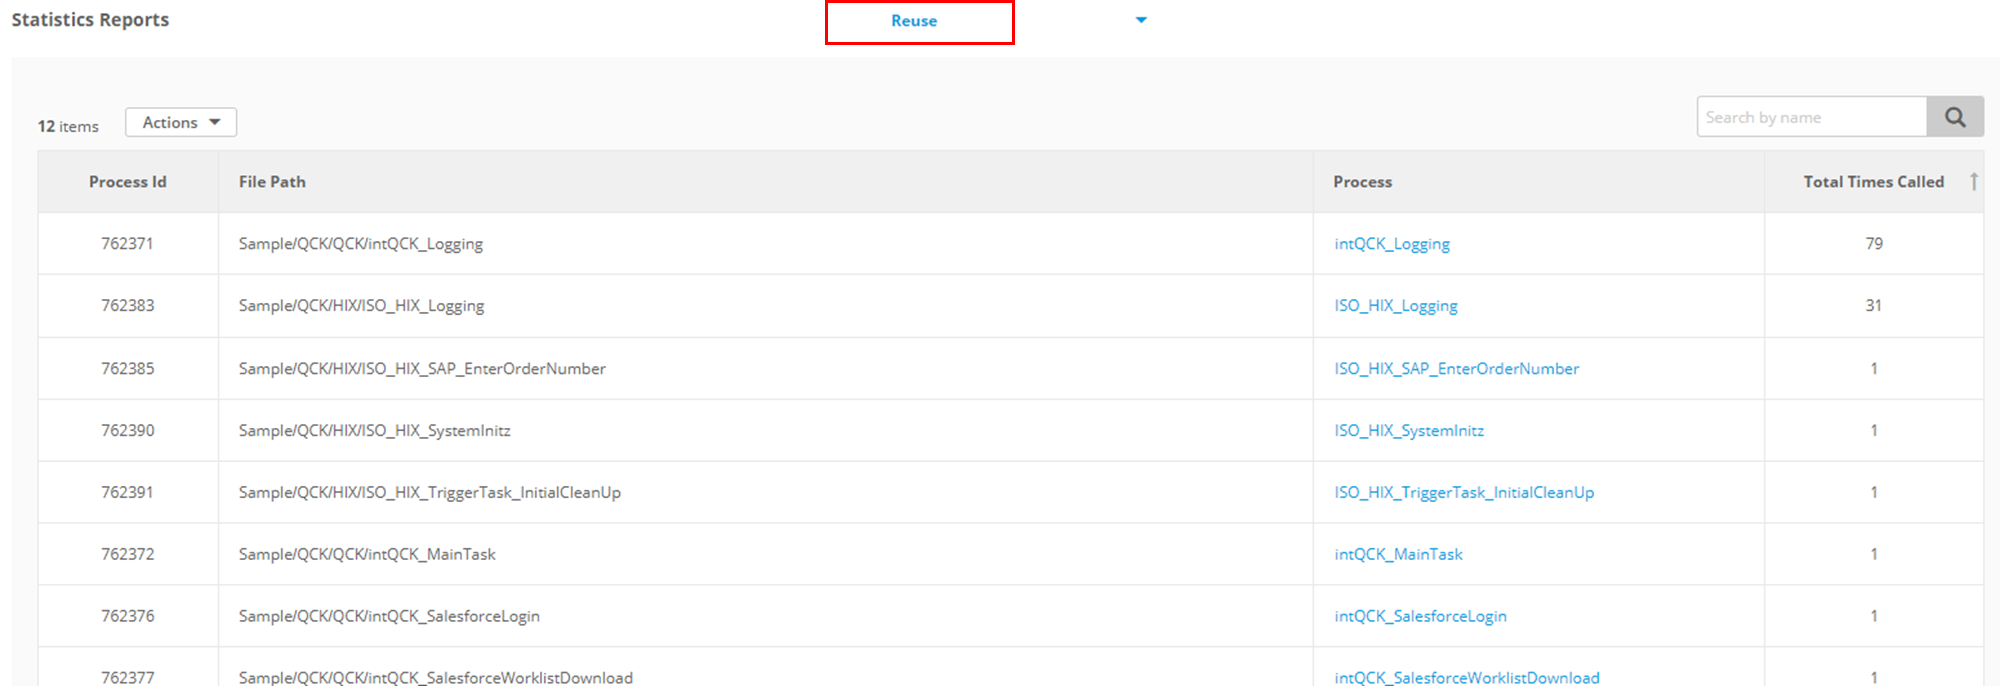
Which components are currently being reused in my estate?
Components being called more multiple times are being "reused". Reuse is beneficial in a numerous ways and should be encouraged. The alternative of having multiple copies of the same or highly-similar code can be very detrimental. Blueprint provides a "Reuse" report to show how many times components are being called in the estate. This is found in a table at the bottom of the Statistics Dashboard after choosing "Reuse" in the table selection drop-down (see below).
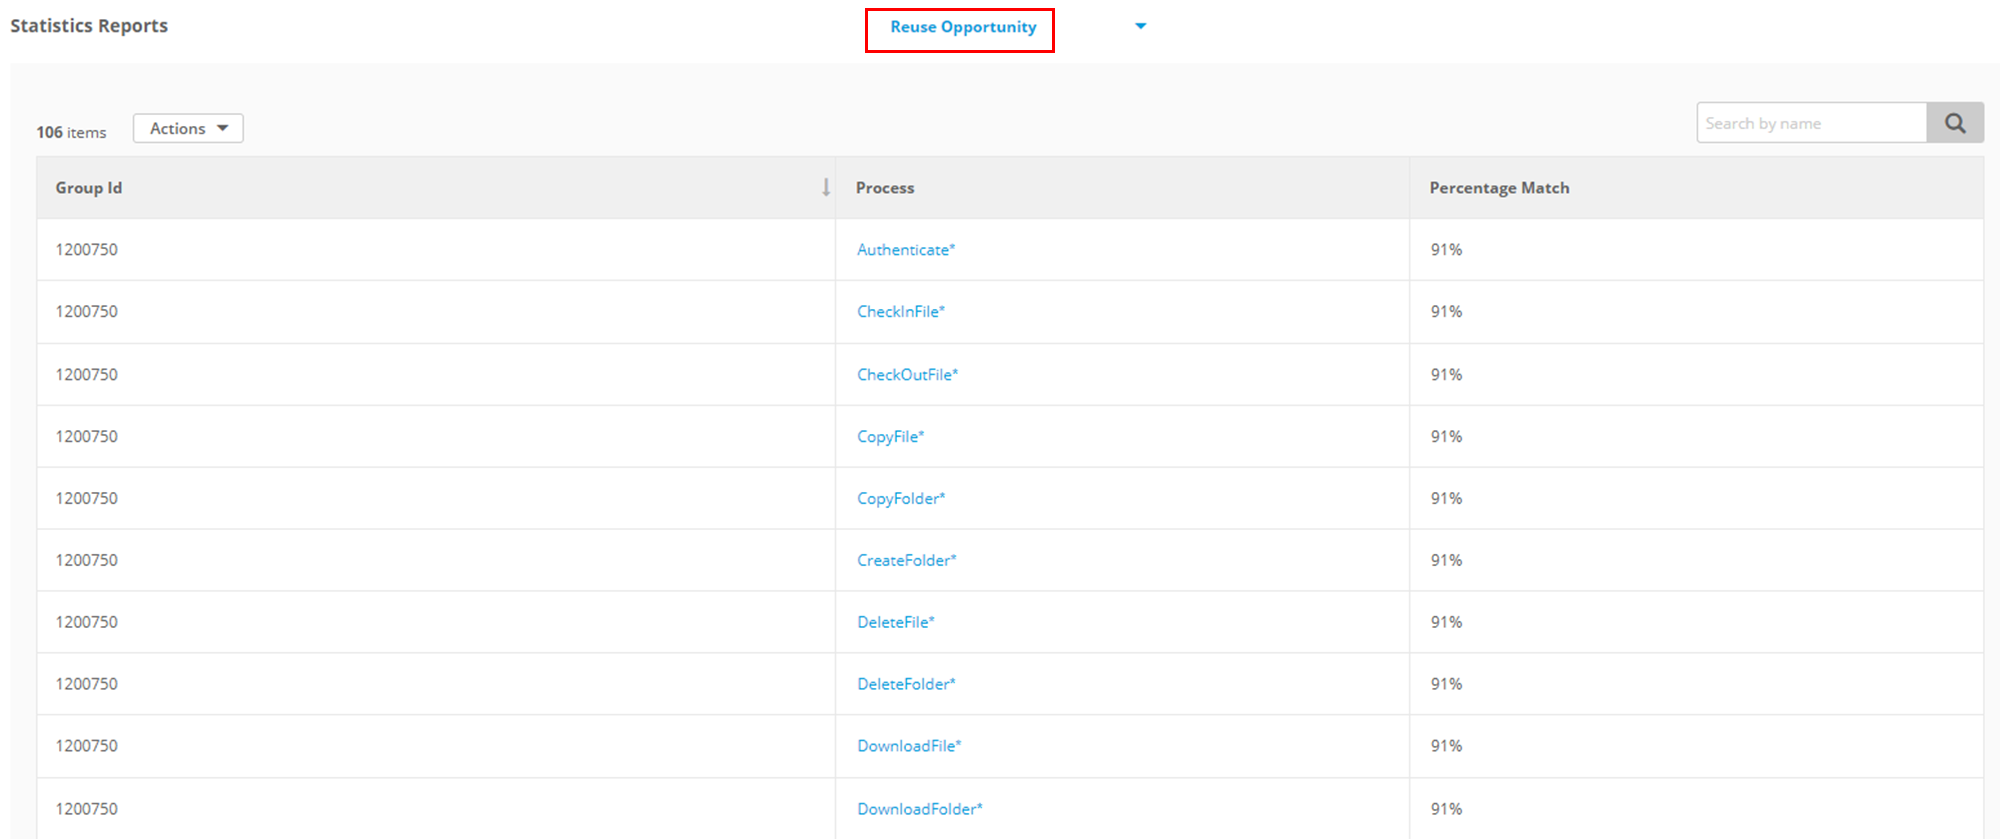
What opportunities are their for additional reuse? (i.e. do I have duplicate/redundant information?)
Opportunities for reuse are detected by Blueprint and shown in a report called "Reuse Opportunities". This report lists groups of components that are identical, or highly-similar, that could be consolidated into a single, reusable component. This is found in a table at the bottom of the Statistics Dashboard after choosing "Reuse" in the table selection drop-down (see below).
How did we do?
A360 to PAD Migration Output Details
Why Choose Blueprint Cloud vs. On Premise ?