Home & Global Resources
Blueprint Assess
Blueprint Migrate
Getting Started
The Blueprint User Interface
Change Your Password
Open a Project
Organize Artifacts and Assets
Close a Project
Status Indicators
Jobs
Exporting from Source RPA Tools
How to export a UiPath Automation Project from UiPath Orchestrator
How to export .bprelease files from Blue Prism
Blue Prism VBO Matching on Import
How to Export .zip files from Automation A360 Control Room
Importing
Exporting
RPA Export from Blueprint
Variable Prefixing
Why We Create Multiple Similar Subflows During Migration
Understanding Wrapper Subflows in Power Automate Desktop
Setting up defaultRunDotNetScriptReferences
AsEnumerable Support
XmlDocument Support
Bulk Reimport/Recalculate
Metabot Migration - Best Practices
Exporting Reusable Flows
DeconstructWorkQueueItem
Artifacts Management
Base Artifact Types
Creating and Managing Artifacts
Utility Panel
Using Descendants View
Global Actions
Rules
Rules Overview
Rule Pre-Requisites
Using Rules
Rules User Interfaces
Using the Rules Table
Using Rules CSV
Using the Rules Wizard
Custom Action Mapping
Reuse Mapping to Power Automate Desktop
Manual Reuse
TODO, Error, and Robin Mapping
Script Mapping
Variable Name Dependency Mapping
Variable Renaming and Initialization
DLL/Method Invocation Mapping
Unresolved References
Work Queues Mapping
Solutions & Best Practices
Working with Migration Output in Power Automate Desktop (PAD)
Blueprism to PAD Migration Output Details
UiPath to PAD Migration Output Details
A360 to PAD Migration Output Details
RPA Value-Mapping Assessments
Why Choose Blueprint Cloud vs. On Premise ?
Setting up SAP for RPA
UiPath Conversion of "Sharepoint Scope and Get File"
API & Developer Resources
REST API Request Header and Parameters
REST API Request Body and Parameters
REST API - Listing Artifacts in the Request Body
REST API - Defining an Artifact in the Request Body
REST API - Defining a Comment in the Request Body
REST API - Defining a Reply in the Request Body
REST API - Defining a Trace in the Request Body
REST API - Filter Parameter
REST API - Defining a User in the Request Body
REST API Requests
REST API - Add Attachment to Subartifact Request
REST API - Get Artifact Request
REST API - Add Traces Request
REST API - Get Project by Id Request
REST API - Update Custom Choice-Property Type Request
REST API - Publish Comments Request
REST API - Publish Artifact Request
REST API - Update Comment Request
REST API - Delete User Request
REST API - Add Comment Request
REST API - Close Review Request
REST API - Get Discussion Status Request
REST API - Update Reply Request
REST API - Get Attachment Request
REST API - Delete Comment Request
REST API - Create Project Request
REST API - Get Group Request
REST API - Rate Comment Request
REST API - Get Child Artifacts of Artifact Request
REST API - Discard Artifacts Request
REST API - List Artifacts Request
REST API - Rate Reply Request
REST API - Move Artifact Request
REST API - Delete Attachment Request
REST API - List Projects Request
REST API - Get Blueprint Product Version Request
REST API - Update Standard Choice Property Request
REST API - Get Review Request
REST API - Reply to Comment Request
REST API - Update User Request
REST API - Get Collection Request
REST API - Delete Artifact Request
REST API - List Collections Request
REST API - Authenticate Request
REST API - Get Artifact Type Request
REST API - List Artifact Types Request
REST API - Delete Reply Request
REST API - Get Root Artifacts of Project Request
REST API - Add Attachment Request
REST API - Create User Request
REST API - List Reviews Request
REST API - List Groups Request
REST API - Get User Request
REST API - Delete Traces Request
REST API - Add Artifact Request
REST API - List Users Request
REST API - Get Artifact Image Request
REST API - Update Artifacts Request
REST API - List Unpublished Artifacts Request
REST API HTTP Methods
REST API - HTTP HEAD Method
REST API - HTTP DELETE Method
REST API - HTTP GET Method
REST API - HTTP POST Method
REST API HTTP Status Codes
REST API - HTTP PATCH Method
Blueprint REST API
REST API Quick Start Example
REST API Requests and Responses
REST API Security and Authentication
REST API Known Issues & Constraints
REST API Requests
REST API Resources
REST API - Defining an ALM Job in the Request Body
Dashboards & Reports
Statistics Report Options
Using Scope and View
Statistics Dashboard
Statistics Reports
Applications Dashboard
Applications Report
Estimator Dashboard
Estimator Reports
How to Change the Main Process Label for Estimations
Bulk Reporting
Call Trees
Blueprint + PowerBI Dashboards
How to Create Microsoft Power Automate RPA Migration Estimates with Blueprint
Assessment Report
Licensing
Settings & Administration
Overview of Blueprint Settings
System Reports
System Reports
License and Activity Reporting
User List
Project Activity
User Roles
Artifact Map
Project Usage
User Activity Report
Audit Log
System Logs
User Management
Creating and Managing Users
Creating and Managing Groups
Creating and Managing Instance Administrator Roles
Creating and Managing Project Administrator Roles
RPA Management
Microsoft 365 Authentication Settings
Integration Reporting
Migrate - Import/Export
Migrate - Dashboards
Migrate
Analyze
Automation360 Authentication Settings
GenAI
Advanced Settings
Projects
Installation
Blueprint Installation Guide
System Requirements
Supported Third-Party Components
Azure App Registration (Power Automate Export)
Release Notes
- All Categories
- Dashboards & Reports
- How to Create Microsoft Power Automate RPA Migration Estimates with Blueprint
How to Create Microsoft Power Automate RPA Migration Estimates with Blueprint
This job aid provides an overview of how Blueprint will enable you to create Microsoft Power Automate RPA migration estimates for your customers. It outlines the data Blueprint provides via dashboard…
This job aid provides an overview of how Blueprint will enable you to create Microsoft Power Automate RPA migration estimates for your customers.
It outlines the data Blueprint provides via dashboards and reports and how to analyze that data to estimate migration effort, highlighting time savings when compared to migrating manually.
Step 1 – Collect Customer’s Data
Migration estimates are based on analysis of the customer’s automation “source code.” Therefore to perform an estimate, you will need to collect your customer’s automation estate—that is, all the files containing the automation source-code to be migrated to Microsoft Power Automate.
Each RPA tool can export its automations to files which can then be imported by Blueprint.
- Automation Anywhere v11: Export automations to an .aapkg file as described here.
- Automation Anywhere A360: Export automations to a .zip file as described here.
- Blue Prism: Export automations to a .bprelease file as described here.
- UiPath: Export automations from the Orchestrator to a .zip file as described here.
Step 2 – Import Data into Blueprint
Once the customer’s automation files have been collected, they must be imported into Blueprint.
Importing this data will automatically populate Blueprint’s RPA Dashboards and reports to provide a broad range of analytical information about the customer’s automation estate. This information provides insights into the effort needed to migrate the automations to Microsoft Power Automate, covered in the next step.
For a detailed tutorial on how to import data into Blueprint, watch one of the following videos according to your origin RPA platform:
- Import Automation Files into Blueprint from Automation Anywhere V11
- Import Automation Files into Blueprint from Blue Prism
- Import Automation Files into Blueprint from UiPath
- View Imported Processes in Blueprint
Step 3 – Analyze Data in Blueprint’s RPA Dashboards
Once the customer’s automations have been imported into Blueprint, navigate to RPA Dashboards.
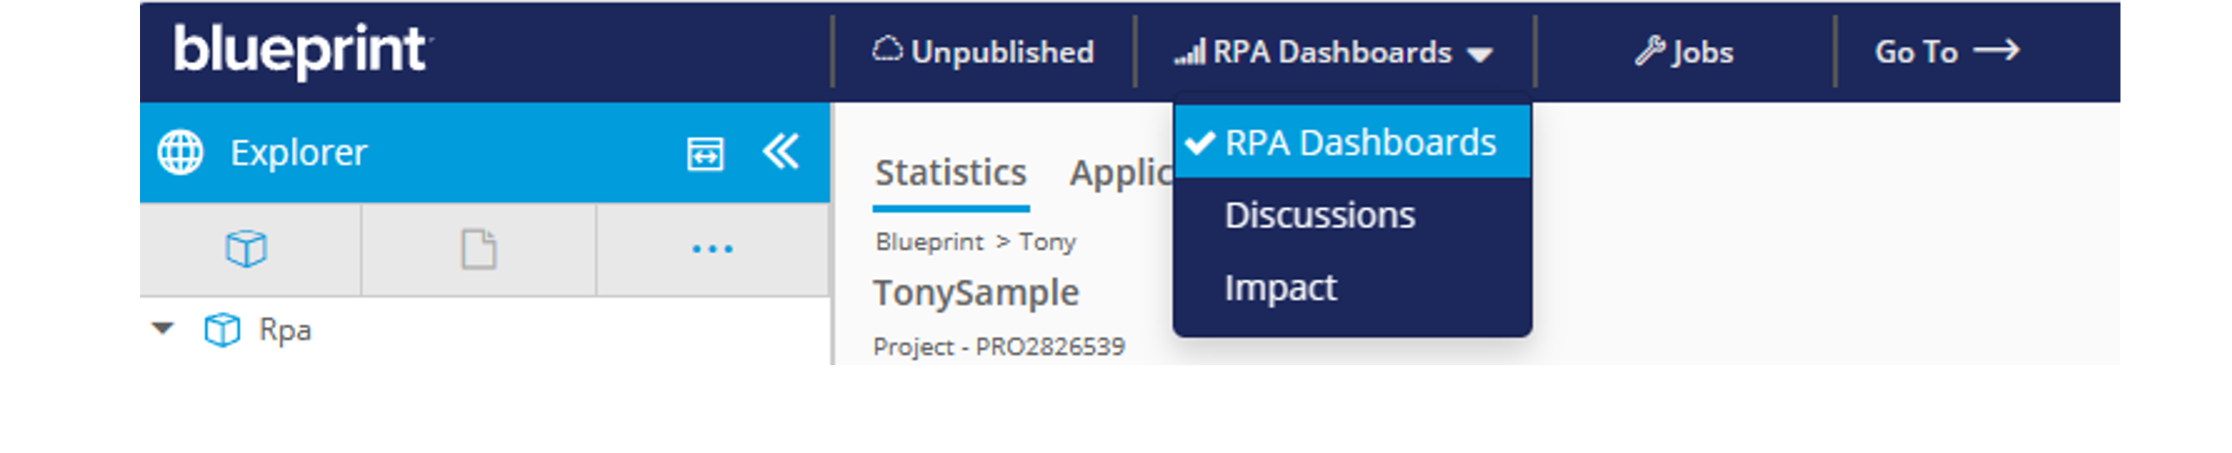
There are three areas of Dashboard and Reports available: Statistics, Applications, and Estimator.
The Statistics and Applications areas provide information and tools that allow you to analyze the automations in great detail. Refer to the Statistics Dashboard and Reports video for an overview of the Statistics area, and the Applications Dashboard and Reports video for an overview of the Applications area.
The Estimator area provides information and tools to help you estimate the effort needed to migrate the automations. This is described in the next section.
Step 4 – Create a Migration Estimate and Present Manual vs Blueprint Time Savings
Blueprint’s Estimator Dashboards and Reports enables you to create proprietary estimates according to your organization’s parameters. The statistics provided in the Estimator Dashboards and Reports can be adjusted according to how your organization performs work.
To enable specific and proprietary migration estimates in Blueprint, you need to:
- Select the scope for the data displayed in the Estimator to ensure the information displayed corresponds to the automations you want to prepare an estimate for. The scope can be a Path scope which is all the processes within a selected project/ folder/process, or a Call Tree scope which is all processes within the selected project/folder/process and all their dependencies (i.e. the processes they call, that those call, and so on). For more information on selecting a scope in the Estimator, see the Selecting a Scope in Dashboards article.
- Adjust the metrics according to your organization’s parameters. The Estimator Dashboard enables you to adjust an array of productivity rate values. Although Blueprint supplies a set of default values for these metrics, you have the flexibility to modify them to more accurately reflect the needs of you organization. For more information on adjusting the values in the Estimator, see the How to Use the Estimator Dashboard article.
- Export the Estimator data to Excel to perform further analysis and adjustments as needed. For information on how to export data and reports to Excel, see the How to Use the Estimator Dashboard article.
1) Manual RPA Migration Estimate:
The manual migration effort/hr can be found in the Estimator panel of Blueprint’s RPA Dashboards:
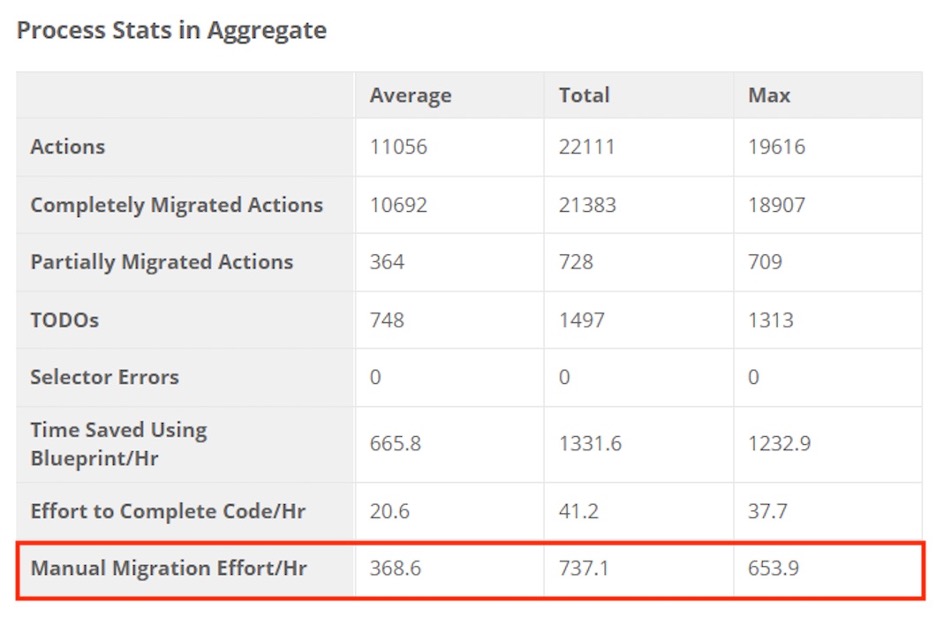
Blueprint calculates the manual migration effort according to the following:
The average developer can code 40 actions or lines of code (LOC) per hour.
If a customer’s RPA estate has 100,000 total actions, then this would take a developer 2500 hours or 312.5 8-hour days to manually rewrite.
Total Actions / 40 lines of code per hour = manual effort
Example: 100,000 total actions / 40 lines of code per hour = 2500 hours of manual effort 2500 hours / 8-hour workday = 312.5 days of manual effort |
2) Blueprint RPA Migration Estimate Time Savings
The time savings you can expect using Blueprint to migrate RPA estates to Microsoft Power Automate can also be found in the Estimator panel of Blueprint’s RPA Dashboards:
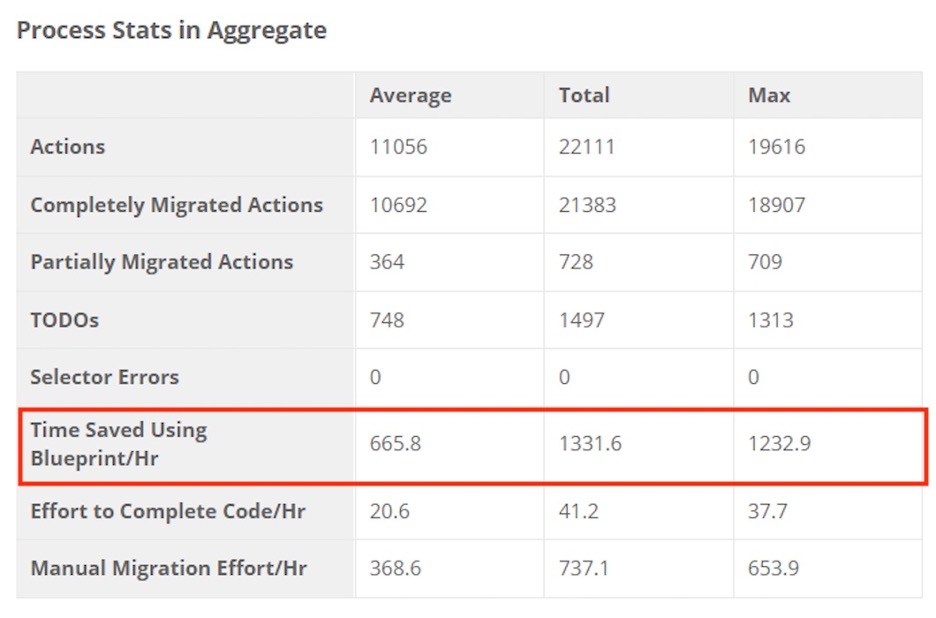
Blueprint calculates RPA migration time savings according to the following parameters:
- Completely migrated actions – the number of actions mapped into Power Automate without any compiler errors
- Average RPA developer productivity – 40 actions/hour
- Partially migrated actions – the number of actions mapped into Power Automate with compiler errors
- Partially migrated actions fix rate – for more information, see the Features available on the Estimator Dashboard (top-right) section in the How to Use the Estimator Dashboard article.
(CompletelyMigratedActions / RPA Developer Productivity) + (PartiallyMigrationActions / Partially Migrated Actions Fix Rate) |
3) Estimate the Amount of Work Left to Complete the Code in Microsoft Power Automate
Blueprint’s RPA Dashboards Estimator panel also indicates the amount of manual work remaining to complete the code for the migrated automations in Power Automate:
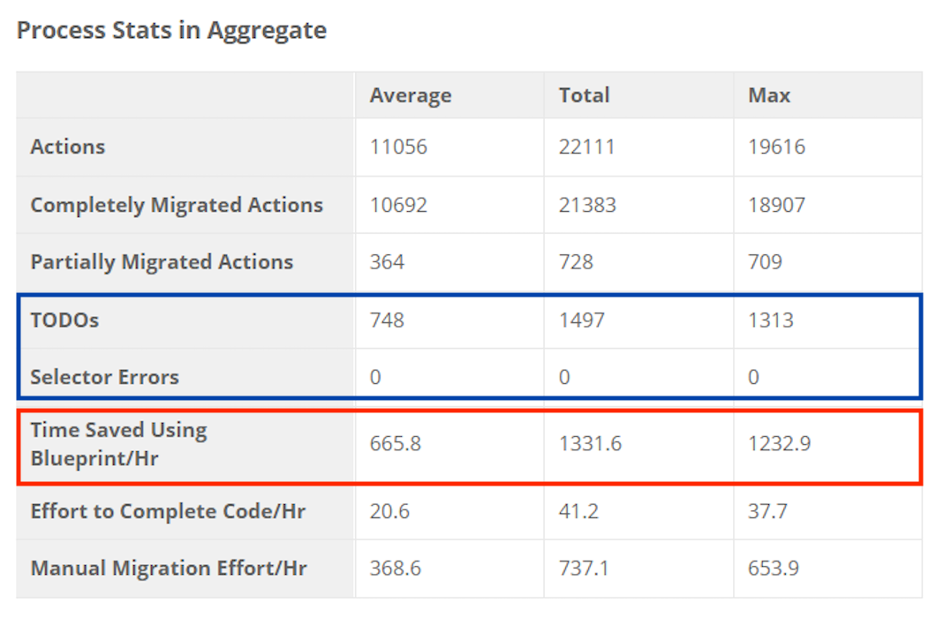
Remaining manual effort is determined according to the number of TODOs and compiler errors.
According to Blueprint’s experience, fixing these issues take the following amount of time in Power Automate, which is how effort to complete code is calculated:
- Each TODO Comment = 1 minute of manual work
- Each Compiler Error = 1 minute of manual work
- Each Broken Element to Respy = 2 minutes of manual work
Example:
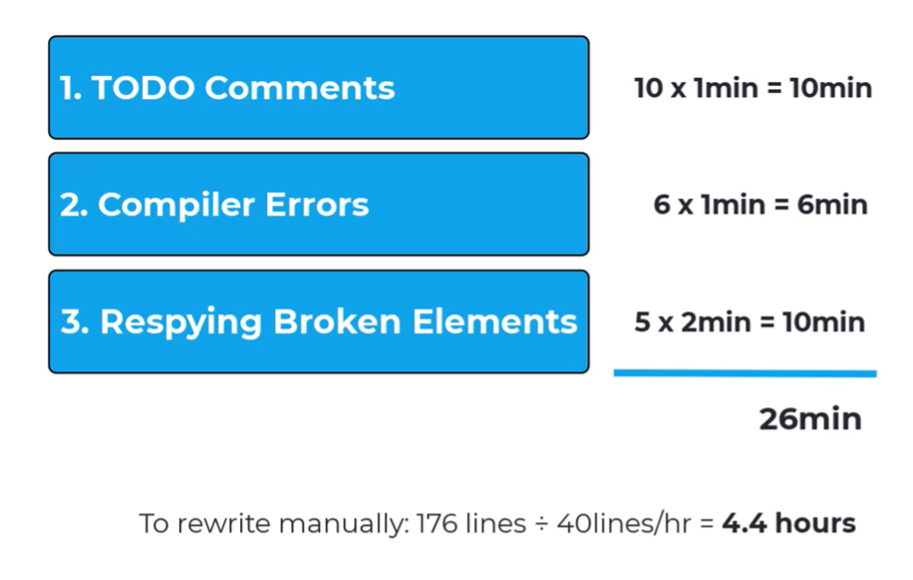
For more information on TODOs and what determines the amount of effort to prepare automations for production, see the Features available on the Estimator Dashboard (top-right) section in the How to Use the Estimator Dashboard article.
For a tutorial on how to treat TODO Comments, Compiler Errors, and Respying Broken Elements in Power Automate, watch the Finishing Migrated Code Estimate video.
With your estimate for the amount of work left to complete migrated code in Microsoft Power Automate, you can now deliver a proposal and quote to your customer for their migration into Power Automate, while also quantifying how much time and money they’ll save over manual methods.
How did we do?
Blueprint + PowerBI Dashboards
Assessment Report