Home & Global Resources
Blueprint Assess
Blueprint Migrate
Getting Started
The Blueprint User Interface
Change Your Password
Open a Project
Organize Artifacts and Assets
Close a Project
Status Indicators
Jobs
Exporting from Source RPA Tools
How to export a UiPath Automation Project from UiPath Orchestrator
How to export .bprelease files from Blue Prism
Blue Prism VBO Matching on Import
How to Export .zip files from Automation A360 Control Room
Importing
Exporting
RPA Export from Blueprint
Variable Prefixing
Why We Create Multiple Similar Subflows During Migration
Understanding Wrapper Subflows in Power Automate Desktop
Setting up defaultRunDotNetScriptReferences
AsEnumerable Support
XmlDocument Support
Bulk Reimport/Recalculate
Metabot Migration - Best Practices
Exporting Reusable Flows
DeconstructWorkQueueItem
Artifacts Management
Base Artifact Types
Creating and Managing Artifacts
Utility Panel
Using Descendants View
Global Actions
Rules
Rules Overview
Rule Pre-Requisites
Using Rules
Rules User Interfaces
Using the Rules Table
Using Rules CSV
Using the Rules Wizard
Custom Action Mapping
Reuse Mapping to Power Automate Desktop
Manual Reuse
TODO, Error, and Robin Mapping
Script Mapping
Variable Name Dependency Mapping
Variable Renaming and Initialization
DLL/Method Invocation Mapping
Unresolved References
Work Queues Mapping
Solutions & Best Practices
Working with Migration Output in Power Automate Desktop (PAD)
Blueprism to PAD Migration Output Details
UiPath to PAD Migration Output Details
A360 to PAD Migration Output Details
RPA Value-Mapping Assessments
Why Choose Blueprint Cloud vs. On Premise ?
Setting up SAP for RPA
UiPath Conversion of "Sharepoint Scope and Get File"
API & Developer Resources
REST API Request Header and Parameters
REST API Request Body and Parameters
REST API - Listing Artifacts in the Request Body
REST API - Defining an Artifact in the Request Body
REST API - Defining a Comment in the Request Body
REST API - Defining a Reply in the Request Body
REST API - Defining a Trace in the Request Body
REST API - Filter Parameter
REST API - Defining a User in the Request Body
REST API Requests
REST API - Add Attachment to Subartifact Request
REST API - Get Artifact Request
REST API - Add Traces Request
REST API - Get Project by Id Request
REST API - Update Custom Choice-Property Type Request
REST API - Publish Comments Request
REST API - Publish Artifact Request
REST API - Update Comment Request
REST API - Delete User Request
REST API - Add Comment Request
REST API - Close Review Request
REST API - Get Discussion Status Request
REST API - Update Reply Request
REST API - Get Attachment Request
REST API - Delete Comment Request
REST API - Create Project Request
REST API - Get Group Request
REST API - Rate Comment Request
REST API - Get Child Artifacts of Artifact Request
REST API - Discard Artifacts Request
REST API - List Artifacts Request
REST API - Rate Reply Request
REST API - Move Artifact Request
REST API - Delete Attachment Request
REST API - List Projects Request
REST API - Get Blueprint Product Version Request
REST API - Update Standard Choice Property Request
REST API - Get Review Request
REST API - Reply to Comment Request
REST API - Update User Request
REST API - Get Collection Request
REST API - Delete Artifact Request
REST API - List Collections Request
REST API - Authenticate Request
REST API - Get Artifact Type Request
REST API - List Artifact Types Request
REST API - Delete Reply Request
REST API - Get Root Artifacts of Project Request
REST API - Add Attachment Request
REST API - Create User Request
REST API - List Reviews Request
REST API - List Groups Request
REST API - Get User Request
REST API - Delete Traces Request
REST API - Add Artifact Request
REST API - List Users Request
REST API - Get Artifact Image Request
REST API - Update Artifacts Request
REST API - List Unpublished Artifacts Request
REST API HTTP Methods
REST API - HTTP HEAD Method
REST API - HTTP DELETE Method
REST API - HTTP GET Method
REST API - HTTP POST Method
REST API HTTP Status Codes
REST API - HTTP PATCH Method
Blueprint REST API
REST API Quick Start Example
REST API Requests and Responses
REST API Security and Authentication
REST API Known Issues & Constraints
REST API Requests
REST API Resources
REST API - Defining an ALM Job in the Request Body
Dashboards & Reports
Statistics Report Options
Using Scope and View
Statistics Dashboard
Statistics Reports
Applications Dashboard
Applications Report
Estimator Dashboard
Estimator Reports
How to Change the Main Process Label for Estimations
Bulk Reporting
Call Trees
Blueprint + PowerBI Dashboards
How to Create Microsoft Power Automate RPA Migration Estimates with Blueprint
Assessment Report
Licensing
Settings & Administration
Overview of Blueprint Settings
System Reports
System Reports
License and Activity Reporting
User List
Project Activity
User Roles
Artifact Map
Project Usage
User Activity Report
Audit Log
System Logs
User Management
Creating and Managing Users
Creating and Managing Groups
Creating and Managing Instance Administrator Roles
Creating and Managing Project Administrator Roles
RPA Management
Microsoft 365 Authentication Settings
Integration Reporting
Migrate - Import/Export
Migrate - Dashboards
Migrate
Analyze
Automation360 Authentication Settings
GenAI
Advanced Settings
Projects
Installation
Blueprint Installation Guide
System Requirements
Supported Third-Party Components
Azure App Registration (Power Automate Export)
Release Notes
- All Categories
-
- How to Use the Statistics Dashboard
How to Use the Statistics Dashboard
This dashboard provides valuable information about a set of Digital Blueprints.

This dashboard provides analytics about a set of imported processes
To access the dashboard:
- Choose RPA Dashboards and Reports dropdown in the main header, then click the Statistics.
- Click the View dropdown and select either Per Process View or Per Call Tree View. This will change the available reports in the center dropdown.
- Select the desired scope on the top right by clicking Change Scope and click on ok. For more information on selecting a scope, please see Selecting a Scope and View in Dashboards.
How to use:
- Features available on the Statistics Dashboard include:
- Total Actions: This is the combined number of Commands and Variables the Digital Blueprint has.
- Total Processes: The total number of processes in the selected scope.
- Refresh: There is a refresh button beside the “Change Scope” button that will retrieve the most current Digital Blueprint processes from the selected scope for analysis and display.
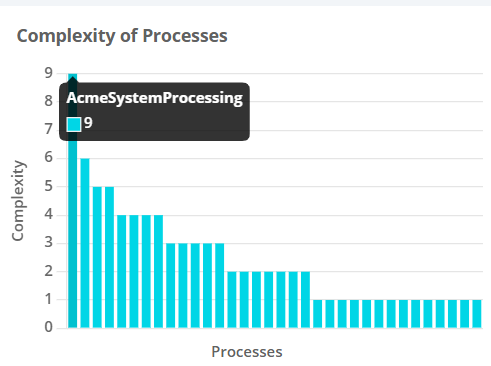
- Complexity of Processes Graph: Shows a graph of every process in the selected scope in order of descending complexity. Complexity refers to the Cyclomatic complexity of a process. The user can hover over the bars on the graph to see which process it represents.
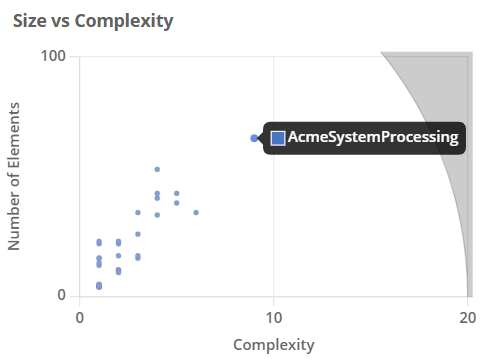
- Size vs Complexity: A scatter graph showing the “number of commands” vs “complexity” for the selected scope. Users can also click on the graph to expand it and hover their mouse over the dots to see which process the dots represent.
- Process Stats in Aggregate: Displays average, total and/or max (highest) metrics for all processes in the selected scope.
- Statistics Report: The main reports displaying information in the Statistics Dashboard. Each report has a search functionality, can be sorted by column, and can be exported to excel via the Actions dropdown. There are multiple reports that can be viewed via the center dropdown:
How did we do?